What is a Piping and Instrumentation Diagram (P&ID)
Part 1: What is a P&ID?
A piping and instrumentation diagram displays the piping components (for example equipment, valves, reducers and so on) of an actual physical process flow and is often used in the engineering projects, such as setting up steam boilers, heat exchangers, electric boilers and more.
To read a piping and instrumentation diagram, simply break down the overall diagram into smaller parts and then trace from a single equipment and follow the pipeline. The latter type shows a picture of the separate steps of a process in sequential order.
Main purpose of using piping and instrumentation diagrams are:
- To better understand the design conditions of an engineering project;
- To operate, maintain and modify the process system efficiently;
- To conveniently layout out and demonstrate the physical sequence of systems with the focus on the control and shutdown schemes, safety and regulatory requirements, and the basic start-up and operational details.
Part 2: History of Piping and Instrumentation Diagram
Generally, a Piping and Instrumentation Diagram is prepared at the planning stage of the process flow, and the installers refer to this chart while setting up a plant. However, there is another chart called Process Flow Diagram or PFD that precedes P&ID.
A Process Flow Diagram showcases the blueprint of the conceptual workflow, i.e., how the fully functional equipment will work post installation. The PFD doesn’t include details such as figures, numbers, or data about the precise measurement.
Once a PFD is prepared, it is used as reference documentation to draw a P&ID that contains the specifics of the workflow like the piping system, the motors, and other important units. However, it is imperative to note that the purpose of a P&ID is to illustrate the important pipes and machineries, and therefore shouldn’t be in much detail. If a particular section of a Piping and Instrumentation Diagram needs some elaboration, a separate chart must be created for that segment.
Part 3: Advantages and Disadvantages of P&IDs
A Piping and Instrumentation Diagram (P&ID) comes with certain merits and demerits, and depending on the infrastructure you are planning to build, these points may widely vary. Nevertheless, some of the most common advantages and disadvantages that an ideal P&ID comes with include:
Advantages
- A well-prepared Piping and Instrumentation Diagram enables the personnel to evaluate the construction process almost accurately
- Helps in forming a strong foundation for control programming
- Serves as a generic symbolic language that can be used by the designers from all regions across the globe to communicate with each other and share their ideas related to the industrial automation
- Helps in preparing and implementing safety control systems
Disadvantages
- P&ID charts are not completely reliable as they do not contain accurate details
- It is challenging to draw Piping and Instrumentation Diagrams independently, and require a Process Flow Diagram (PFD) as a referral illustration
- Cannot be reused in multiple projects, and a separate Piping and Instrumentation Diagram must be tailored for each company
- Correct symbols and icons must be used while drawing a Piping and Instrumentation Diagram failing to which, the engineers may end up preparing a faulty piece of equipment
Piping and instrumentation diagrams have been used in many fields such as metallurgical sector, air conditioning industry, power generator sectors and so on. The key usages of such diagrams are:
- For designing a manufacturing process for a physical plant with complex chemical or mechanical steps. This is especially important for a safety check.
- For training new workers and contractors before they start work in the plant.
- To derive project capital cost estimate and develop project contract specification, for example, the guidelines and standards for facility operations.
Part 4: P&ID Symbols
There is no standard pattern for a piping and instrumentation diagram, but you may see some of the following elements:
- Different kinds of equipment, including valves, reducers, drains and so on;
- Equipment details such as sizes, tag numbers, rating, capacity and more;
- Details about the specifications, including element identification, insulation requirement, flow directions, interconnections reference, quality level, various interfaces, permanent start-up, and flush lines.
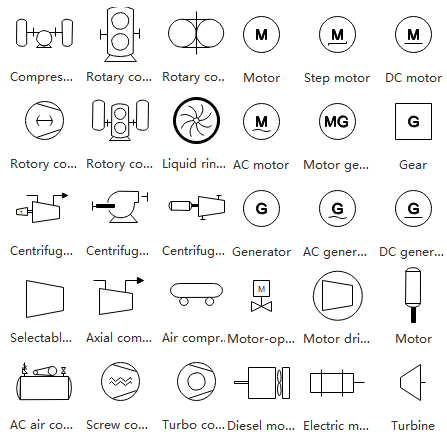
Equipment
The equipment has unique miscellaneous units that are different from the other piping and instrumentation diagram categories. The equipment category contains facilities and devices such as compressors, conveyors, motors, turbines, vacuums, and more.
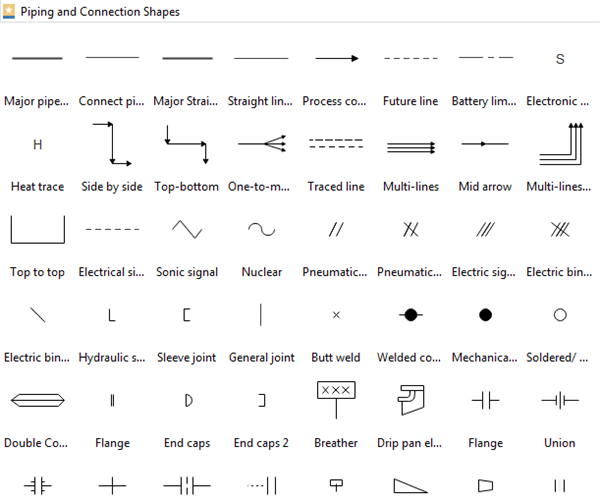
Piping and Connection Shapes
Pipes are used to transporting fluid substances in industrial diagramming. Piping has several different materials, such as metal and plastic, to create various types, including multi-line pipes, separators, and so on.
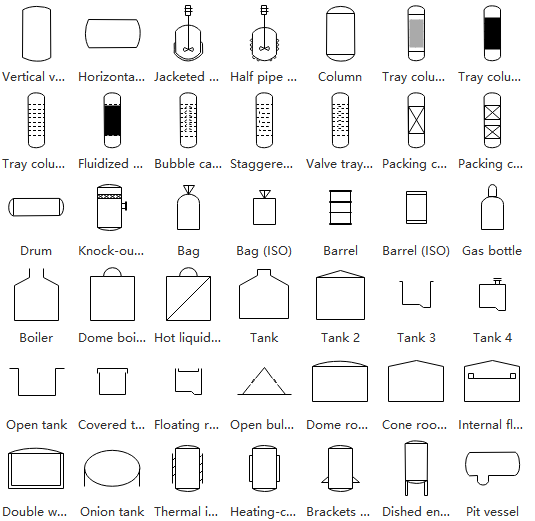
Vessels
Normally, a vessel is a kind of container used to store fluid or change the fluid features during storage. The vessels category covers from tanks to columns as you can see below:
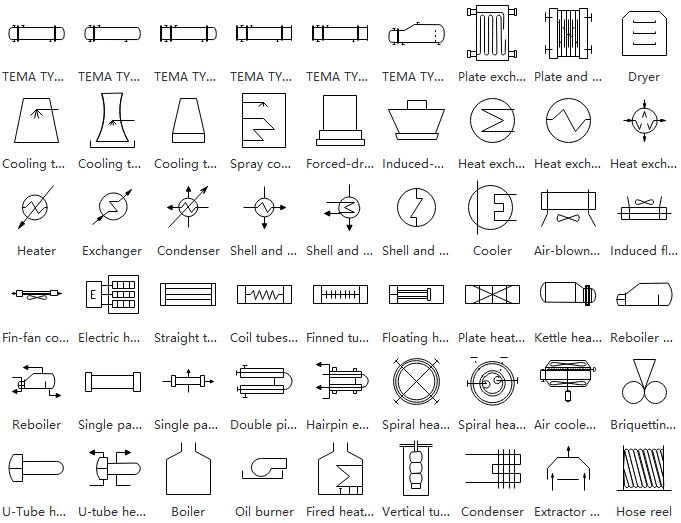
Heat Exchangers
A heat exchanger is used to transfer heat from various kinds of areas or mediums efficiently. This category includes many different forms of devices such as boilers, condensers, hose reels, and more.
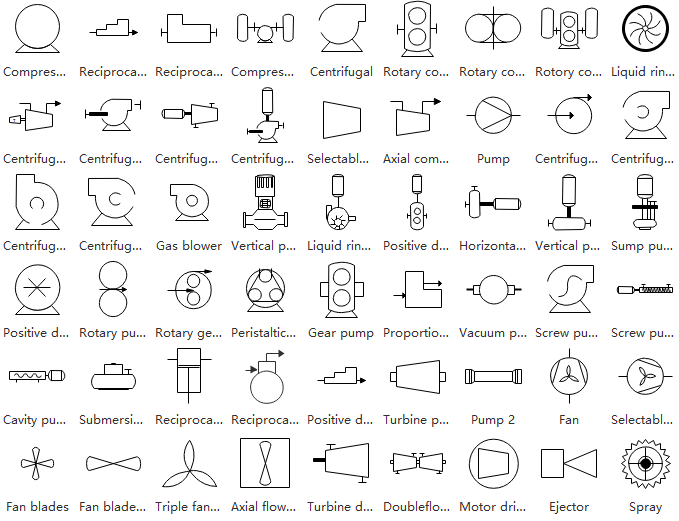
Pumps
Generally, a pump is a kind of device that uses pressure to raise or compress fluids in and out of other industrial facilities. This category covers pumps, fans, ejectors, sprays, and more.
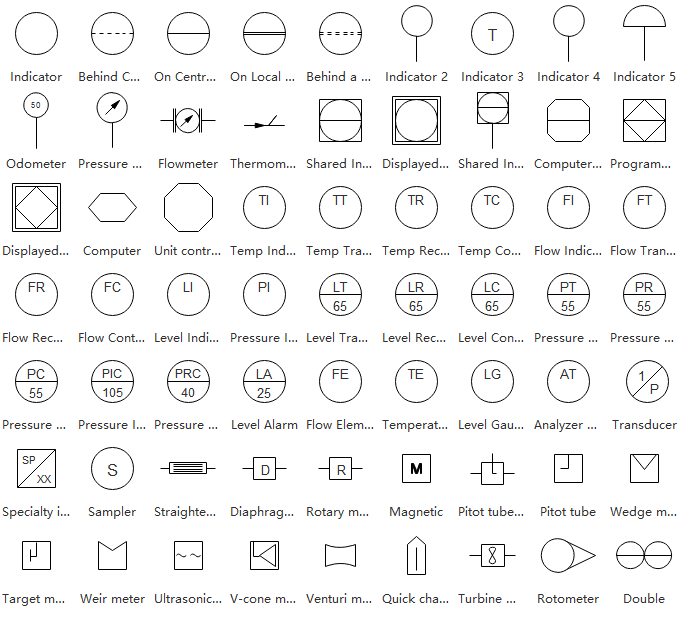
Instruments
An instrument is used to measure and control quantities, including flow, temperature, or pressure. The instruments category includes house indicators, transmitters, weir meter, controllers, and so on.
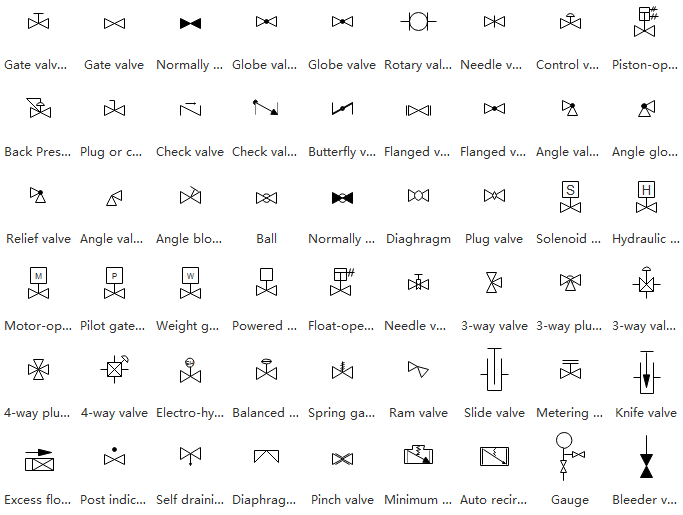
Valves
A valve is used by engineers to control the flow of a fluid by opening or closing passageways in a piping system. This section includes rotameters, gauges, balls, and more.
Part 5: How to Create a P&ID
Step 1: Launch EdrawMax on your cpmputer. Navigate to [Industrial Engineering] and open a P&ID example.
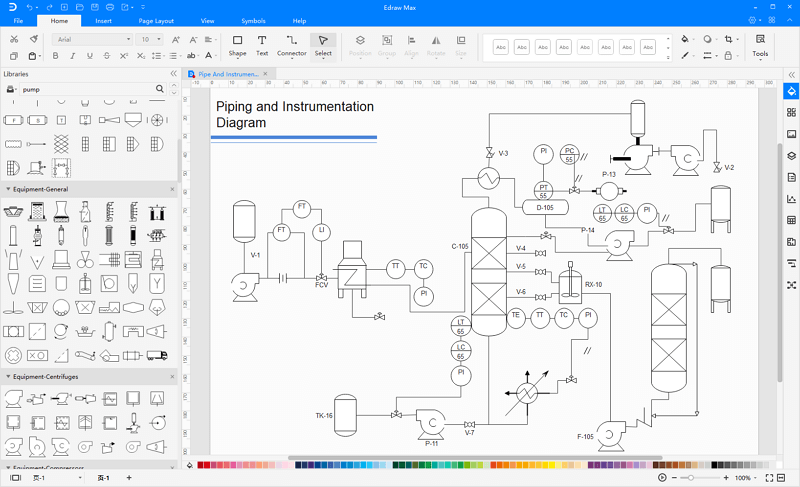
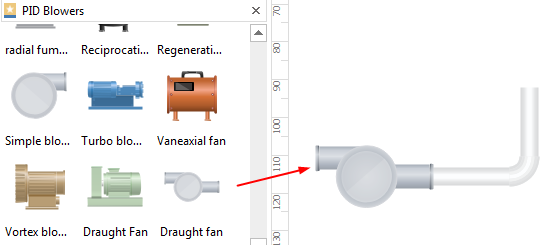
Step 2: Drag and drop built-in symbols from the library. Alternatively, you can use a preset template to faster your work.
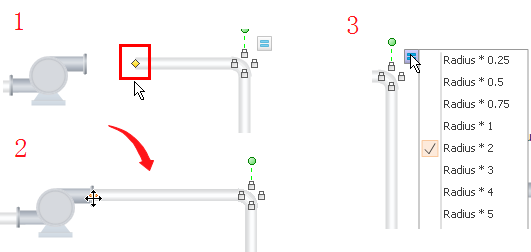
Step 3: Connect piping and instrumentation diagram shapes and equipment with pipelines in different directions. Adjust the length and width of a pipeline according to your specific needs. Also, keep in mind that some equipment may require special configuration.
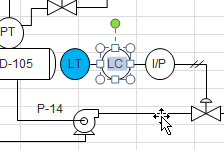
Step 4: Customize your piping and instrumentation shapes by changing the default color and size. You can further add text to or label each of the equipment.
Step 5: When your P&ID is complete, you can export it to JPG, PNG, SVG, PDF, Microsoft Word, Excel, PowerPoint, Visio, HTML with just a single click. So you can share your drawings with people who don't use EdrawMax with no need to looking for ways of converting file formats.
EdrawMax
All-in-One Diagram Software
- Superior file compatibility: Import and export drawings to various file formats, such as Visio
- Cross-platform supported (Windows, Mac, Linux, Web)
Part 6: Tips for Piping and Instrumentation Diagram
A couple of important points that you must keep in mind while preparing a Piping and Instrumentation Diagram to get the best out of it are:
- Make sure to include important parts such as mandatory valves, mechanical equipment, flow direction, computer control system inputs, etc. in the P&ID
- Avoid adding extremely detailed information such as control relays, elbow trees, etc. If need be, these elements can be demonstrated in a separate, comprehensive chart
- Make sure to create a list of equipment that must be added to the final unit, and then use the list while preparing the Piping and Instrumentation Diagram
- Always connect the pipes in the diagram, and perform several dry runs on the chart itself to assess and eliminate the flaws that the unit may stumble upon after implementation
- Remain open for the suggestions from the experienced engineers and designers to get the best and finest instance of the P&ID
Part 7: Free P&ID Templates
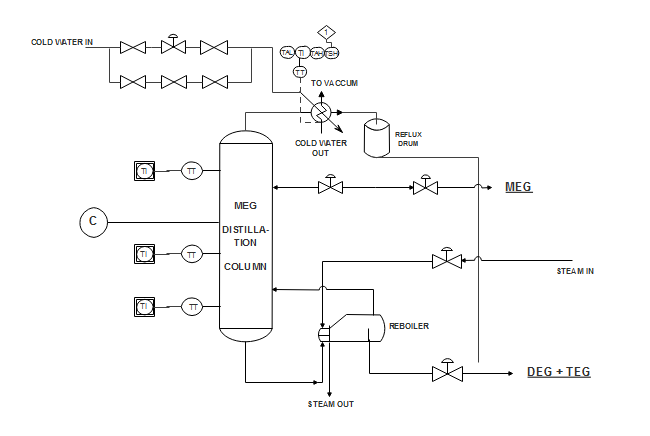
Water Boiling Process
This example here shows a general process for changing from the liquid phase to a gaseous phase. In this case, the liquid's vapor pressure has the same level as the atmospheric pressure exerted on the liquid.
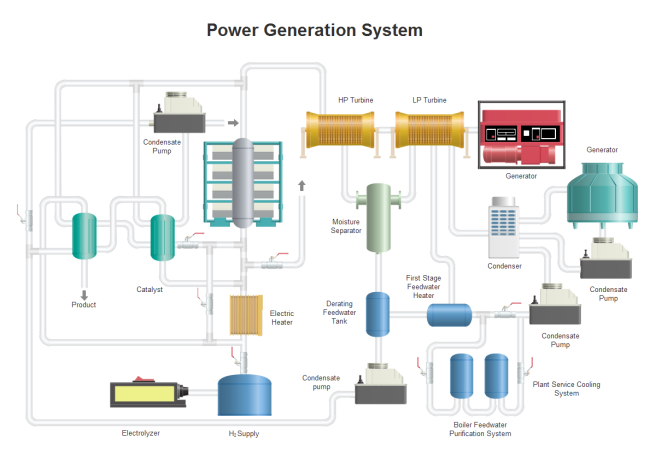
Power Generation System
A power generation system, which is also called a power plant or power generation station, is a set of industrial equipment for generating electric power. You can see different facilities, such as power supply tanks and LP turbines, in the following diagram.
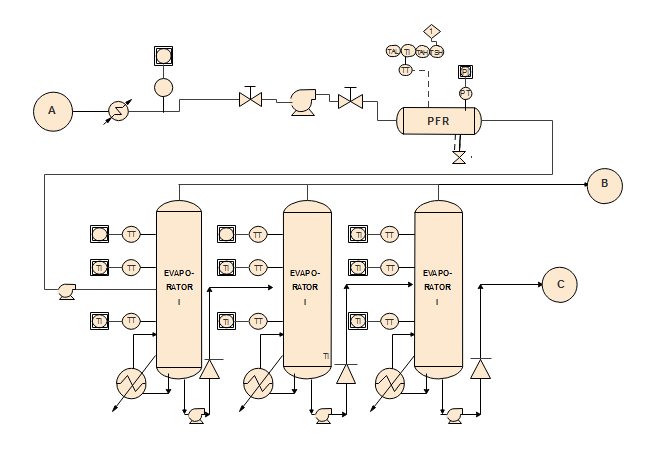
Evaporate Process
This diagram here shows an evaporator system with some elements and three key evaporators. By following the pipelines in this diagram, you can clearly see how water is evaporated.
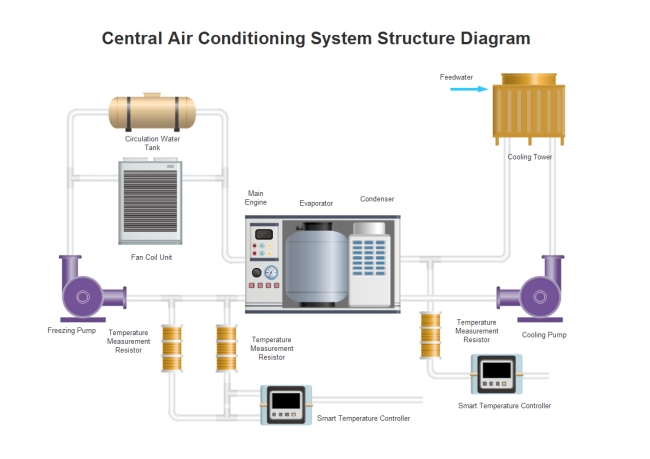
Air Conditioning System
This piping and instrumentation diagram example here shows the general process of removing heat and moisture from a certain space to improve the living environment. The key air conditioner is set at the middle and equipped with pipelines in different directions.
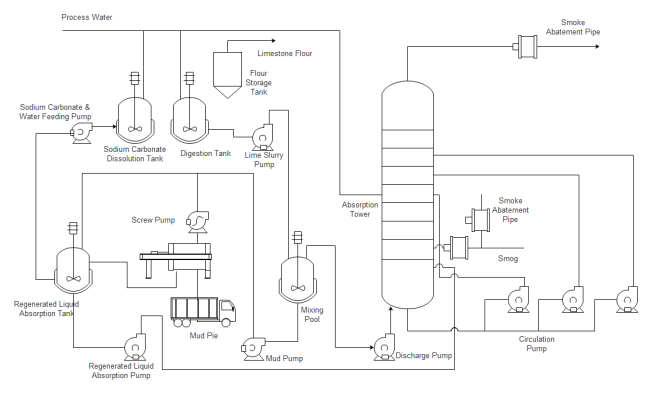
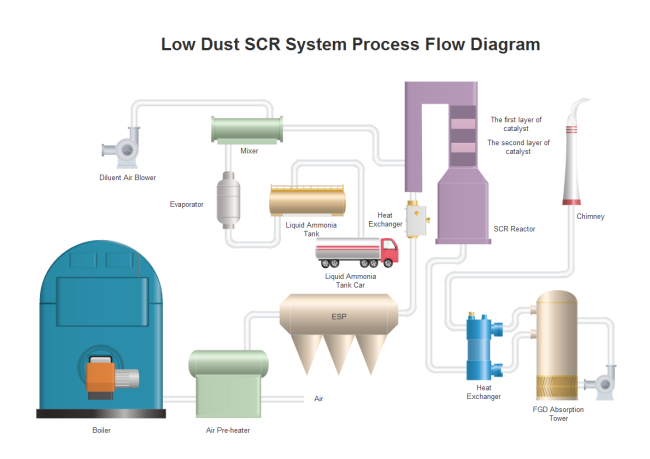
Low Dust SCR System
SCR refers to the Selective Catalytic Reduction, which is an advanced emissions control system. Hit the diagram below to check out more details, or you can free download it in PDF format.
Part 8: Conclusion
A Piping and Instrumentation Diagram is an essential element for preparing all types of industrial equipment. While it is used as a reference chart that the engineers rely upon during the practical implementation of the units, the diagram itself is based on a Process Flow Diagram or PFD that reflects the conceptual arrangement of how the automation machine should work.
Because a Piping and Instrumentation Diagram (P&ID) does not contain minute details about the small parts used in a piece of equipment, the engineers are required to create a separate chart to showcase the petty components. Such a chart may also include precise figures and specifications of the gears to help the technologists manufacture and/or set up the machine according to the exact needs of the production plant.
More Templates
Here are more piping and instrumentation diagram templates for you to easily understand the field. All of these are editable with a free download piping and instrumentation diagram software. Feel free to click on any of them to see more details.
|
|
|
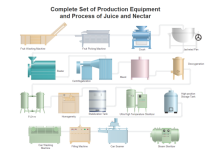
| Factory System | Simple Process Control System | Juice and Nectar System |
|
|
|
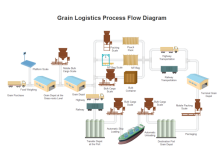
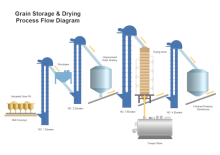
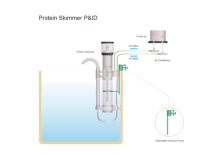
| Grain Logistics PFD Example | Grain Storage Drying | Protein Skimmer Example |