Top 20 Science Graphic Organizers
With EdrawMax, you can create clear and comprehensive science graphic organizers even without prior experience.
Top 1:Flowchart
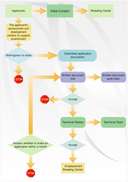
Flowchart helps to clarify how things are currently working and how they can be improved.
A flowchart is a diagrammatic representation that illustrates the sequence of operations to be performed to gain the solution of a problem. Flowcharts are generally drawn in the early stages of formulating computer solutions.
Top 2:Mind Mapping
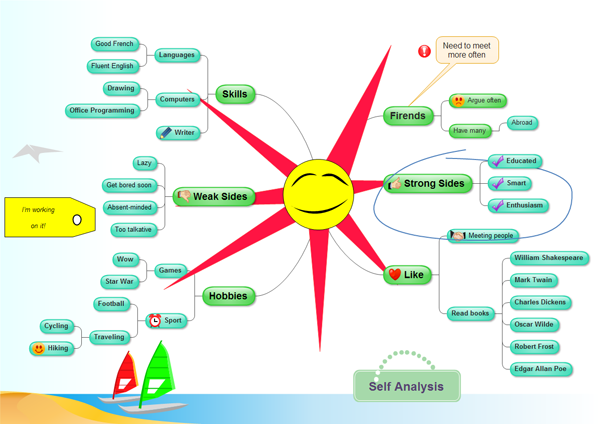
Represent notes, memory, learning, creative thinking, associate ideas, tasks, or other items linked to and arranged around a central key word or idea.
Mind map helps you take notes, brainstorm complex problems, and think creatively. A mind map is often created around a single word or text placed in the center, to which associated ideas, words and concepts are added.
Top 3:Venn Diagram
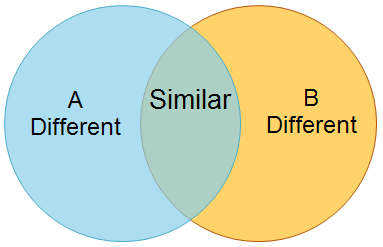
Venn diagram is a graphical illustration of the relationships between and among sets of data, groups of objects that share something in common.
The Venn Diagram is made up of two or more overlapping circles that show all possible logical relations between a finite collection of sets.
Top 4:Step by Step Chart
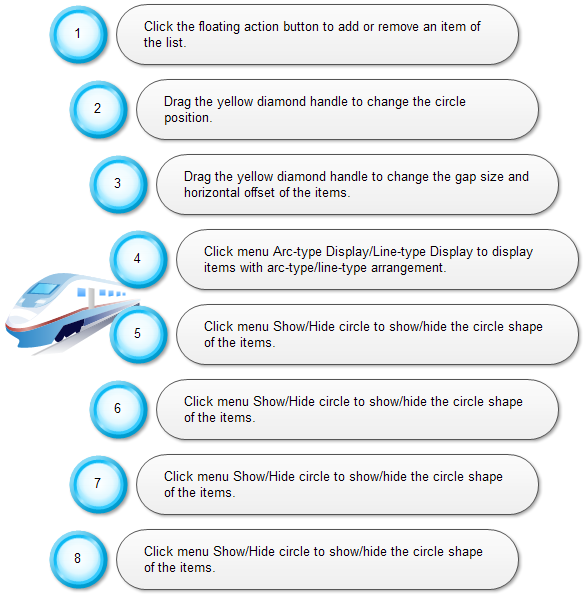
Step Charts write a procedure or a change in value over time.
Help you list steps, series or topics according to certain order.
Top 5:Sequence Chart
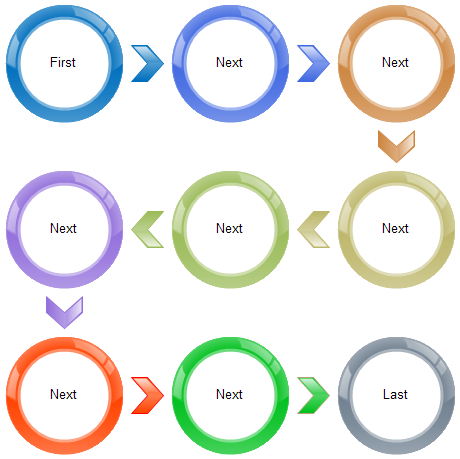
Sequence diagram shows how processes operate with one another and in what order.
For example: List steps or events in time order.
Top 6:Spider Chart
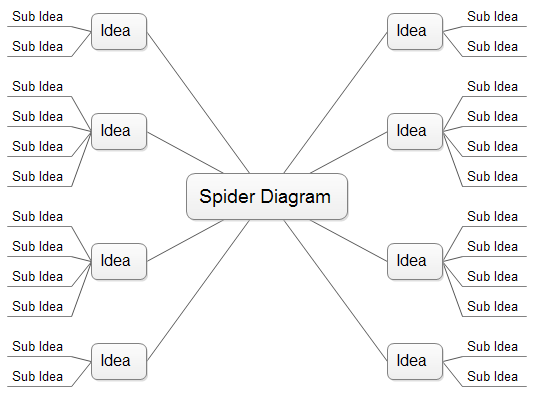
Spider chart is a very effective tool for comparing multiple entities based on different characteristics.
Spider charts facilitates thinking about the main ideas and then how the ideas are seen to be present in many parts.
Top 7:KWL Chart
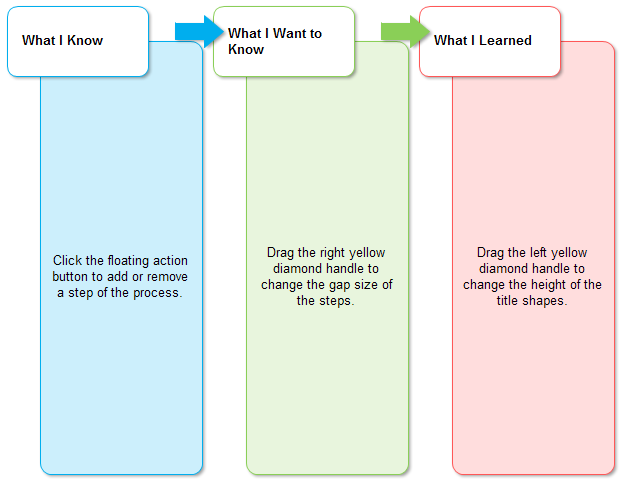
KWL chart helps you gather information, solve a problem, or think through a research topic.
KWL Chart tracks what a student knows, wants to know, and has learned about a topic, which can be used before, during, and after research projects.
Top 8:Observation Chart
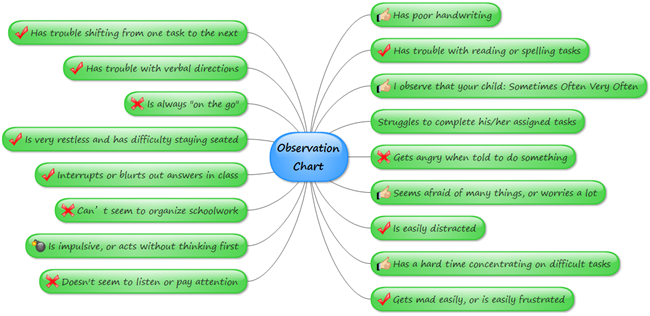
Observation chart helps you work prior to a creative writing assignment or for scientific investigations more effectively.
Top 9:Problem Solution Chart
Problem solution chart helps students focus on the four areas critical to problem-solving.
It is a choice ideal, too to identify the problem, list the consequences or results of that problem, isolate the causes, and propose solutions.
Top 10:Planning Chart
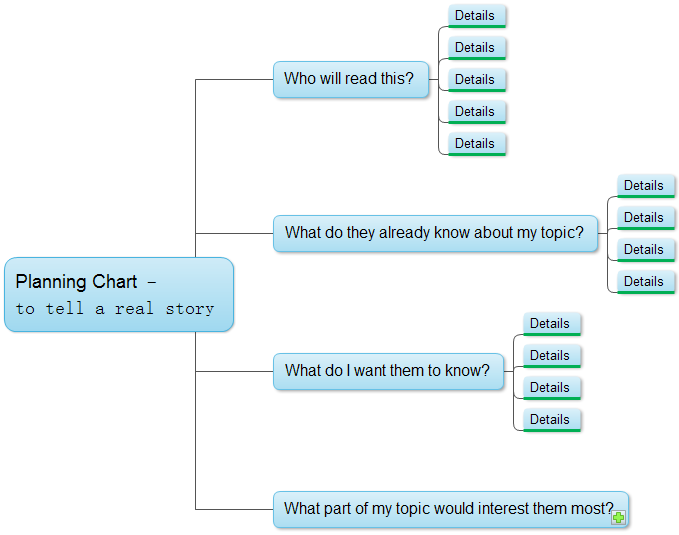
Planning chart helps to plan a project, find out how a visual overview of your project plan can help to minimize risks and help you succeed.
Top 11:Fact-Opinion Chart
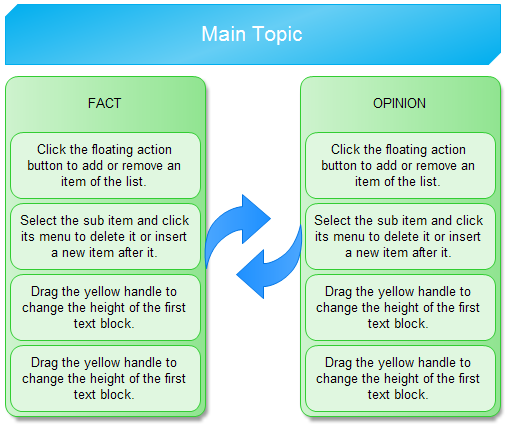
Fact-opinion chart helps explain the two and explain that generally.
Student will find more facts in a nonfiction text.
Top 12:Four Column Chart
Four-column chart helps students organize details and information about the topic of their choice in this.
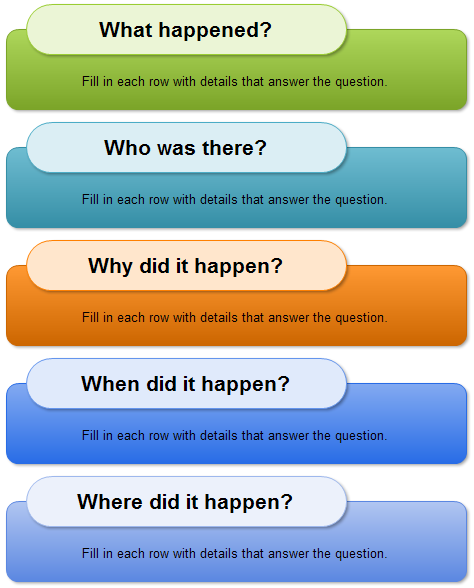
Top 13:Five Ws Chart
Five Ws chart helps in problem solving, decision making, studying, planning research and brainstorming.
Top 14:Describing Wheel
Describing wheel determines central ideas or themes of a text and analyze them.
The describing wheel is a graphic organizer for students, allowing them to explore a topic or subject while utilizing critical thinking skills.
Top 15:Purpose Chart
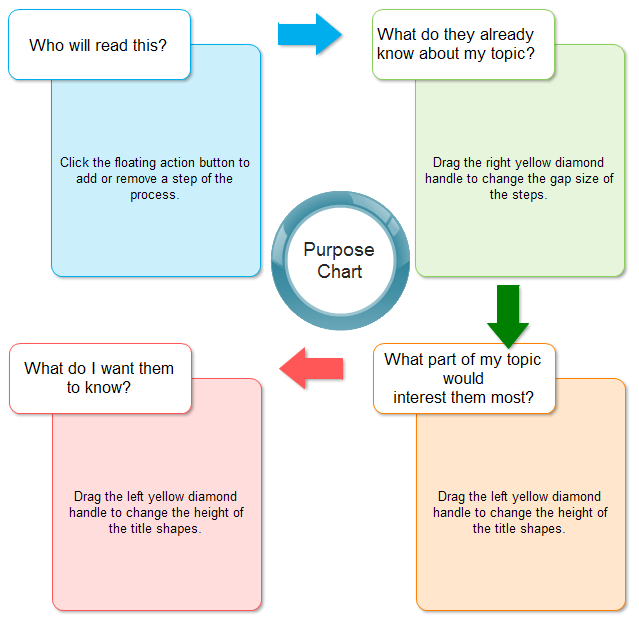
Purpose chart helps in identifying the appropriate purpose. It's an ideal tool to analyze purpose.
Top 16:Inverted Triangle
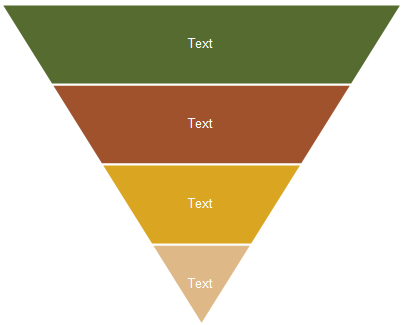
Inverted triangles help signal either a reversal or a continuation.
Top 17:ISP Chart
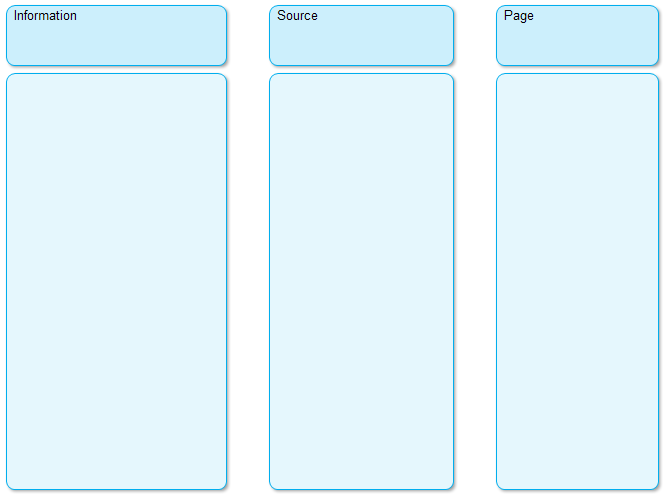
ISP Chart is commonly used for referencing a research.
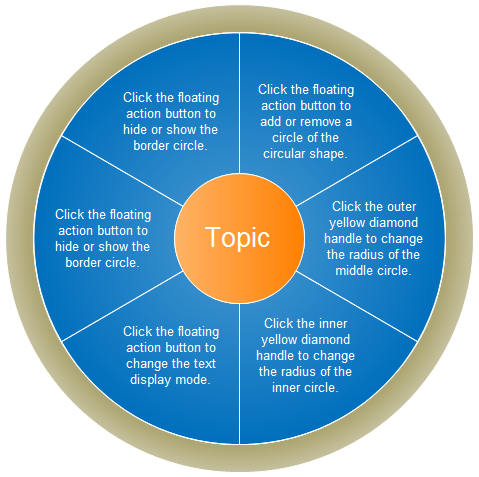
Top 18:Radial Diagram
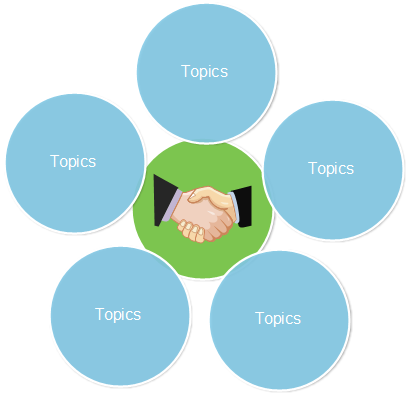
Radial diagrams helps illustrate relationships between a core idea and outer elements.
Top 19:List
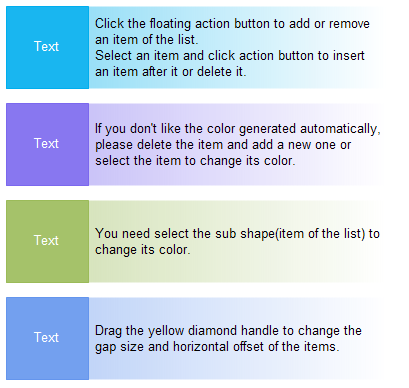
List shows proportional, interconnected or hierarchical relationships.
Top 20:Persuasion Map
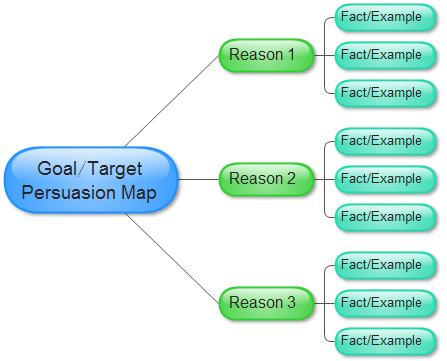
Persuasion map is an interactive graphic organizer that enables students to map out their arguments for a persuasive essay or debate.
EdrawMax
All-in-One Diagram Software
- Superior file compatibility: Import and export drawings to various file formats, such as Visio
- Cross-platform supported (Windows, Mac, Linux, Web)
See how graphic organizers can be used to improve learning, and get free printable graphic organizers.
More Infomation