Simple Scatter Plot Maker - Make Great-looking Scatter Plot
Video Tutorial - How to Create a Scatter Chart
Discover why Edraw is an awesome scatter plot maker: Download it Now.
Definition of Scatter Plot
A scatter plot, scatterplot, or scattergraph is a type of mathematical diagram using Cartesian coordinates to display values for two variables for a set of data. The data is displayed as a collection of points, each having the value of one variable determining the position on the horizontal axis and the value of the other variable determining the position on the vertical axis. This kind of plot is also called a scatter chart, scattergram, scatter diagram, or scatter graph. (Scatter plot, Wikipedia)
Simple Scatter Plot Maker - Make Great-looking Scatter Plot
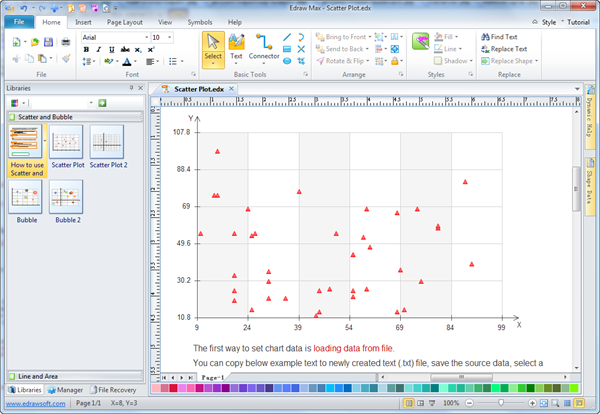
Edraw scatter plot maker is used to visually present what happens to one variable when another variable is changed. It is completely integrated with MS Office. For those who are already used to other Microsoft apps such as Word or Excel, the interface will be rather familiar. Just drag and drop scatter plot symbols simply, apply built-in design themes, and your finished scatter plot will be shared in a presentation or PDF automatically with a single click. Whatever level of user you are, you can produce professional, precise and elegant scatter plots that no other program can match. You imagine and design. We do all the hard work for you.
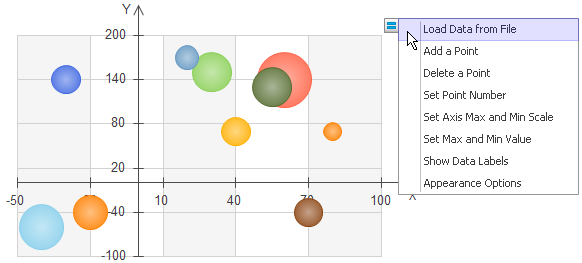
Scatter plot maker can import data. It's more intuitive to plot data points on a horizontal and a vertical axis in the attempt to show how much one variable is affected by another.
System Requirements
Works on Windows 7, 8, 10, XP, Vista and Citrix
Works on 32 and 64 bit Windows
Works on Mac OS X 10.2 or later
Scatter Plot Maker Features
- An automated Charting Software which allows you to create scatter plot Gauges / Speedometer, Charts, and Maps out of your Excel Data with one click of a button.
- A complete all-in-one package making solutions tailored to the needs of all drawing types. Over 200 diagram types are supported, including pie, line, doughnut, bar chart, flowchart, mind map and so on.
- Elaborately designed templates for instant start serve as big time savers.
- Drag and drop interface, point-and-click editor and auto formatting tools greatly simplify the diagramming process.
Scatter Plot Template
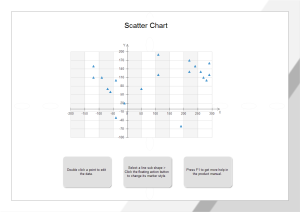
A scatter chart analysis template is available from data. Scatter plot is similar to line chart in that they both start with mapping quantitative data points. The difference is that the decision is made that the individual points should not be connected directly together by a line, but express a trend instead.
Line Plot Template
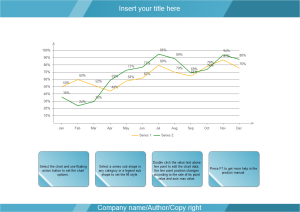
A line comparison graph chart template makes it easy to read, digest, compare and see the trends. Comparing the features and benefits of our small business lines of credit and loans.