Line Graph Charting Software
Introduction to Line Chart
Line charts are used for connection of individual data points in a data view. They are especially useful when it comes to display trends over time. Compared to other chart types, line charts are best suited to displaying trends. The trajectory of the line, up or down, gives you clear information on how a specific data point progressed over time.
A Fast and Easy Way to Create Line Chart - Edraw
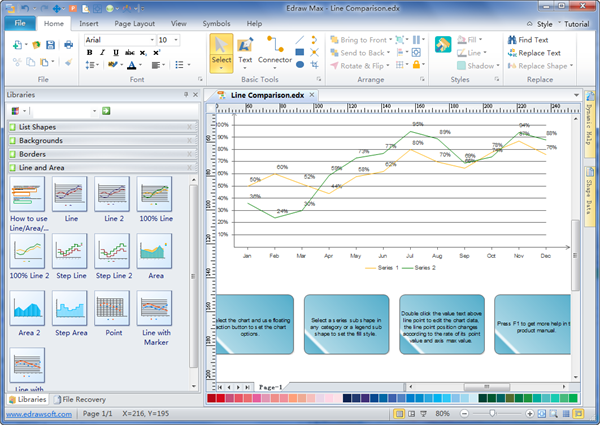
Edraw line graph charting software is an all-in-one tool to make awesome custom line charts while saving everyone's precious resource - TIME! It equips everybody to produce professional-looking graphics. With a minimal cost for the product, maximize the return on investment. Isn't it amazing? Have Edraw, embrace simplicity.
Video Tutorial - How to Create a Line Chart
Discover why Edraw is an awesome chart maker: Try it FREE.
System Requirements
Works on Windows 7, 8, 10, XP, Vista and Citrix
Works on 32 and 64 bit Windows
Works on Mac OS X 10.2 or later
Features beyond Expectation
- Visual and effective display of data series;
- Automatic changes of the line point position according to the modified rate of its point value and axis max value;
- Easy way to set chart data by loading data from files;
- Various types of line, mainly including step line, line with markers and 100% line;
- Identification and notification of key events with the Key Event line chart example;
- Supports to add description to any shape or line;
- Highly detailed and informative product manual for more help.
Line chart is commonly used to display continuous data over time, set against a common scale, and therefore is ideal for showing trends over time. With lots of pre-drawn line graph examples and more than 6000 symbols, charting couldn't be easier!
It works at the following line graphs:
Edraw is easy to design simple line graph, 100% line graph, step line graph, area line graph, step area graph and more.
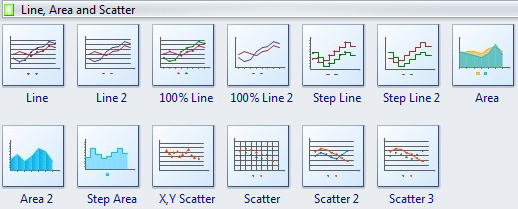
Line chart shows trends in data at equal intervals.
Line displays trends over time or categories. It is available with markers, displayed at each data value.
Stacked Line displays the trend of the contribution of each value over time or categories.
100% Stacked Line displays the trend of the percentage each value contributes over time or categories.
Set Chart Data Quickly and Effortlessly
The first way to set chart data is loading data from file. You can copy the example text included in the User Guide to newly created text (.txt) file, save the source data, select a line chart shape, click floating menu Load Data from File to load the text file.
The second way to edit chart data is edit the data labels and click floating menu to change its setting.

Line Chart Example - Key Event
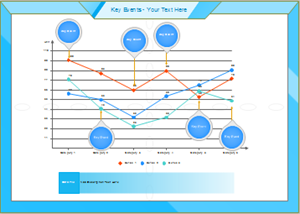
A elaborately created line chart example is presented here to benefit our users.
Line Chart Example - Comparison
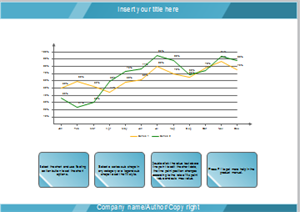
To help our users with a clearer understanding of Line chart, we provide this example for reference.