Edraw Support Center
Get quick answers and step-by-step instructions in our support center.
Insert Chart
To insert a chart, you can
- Go to Insert > Insert Chart or click Insert Chart on the right Chart pane.
- In the pop-up Insert Chart window, choose the desired type of the chart.
- Click OK.
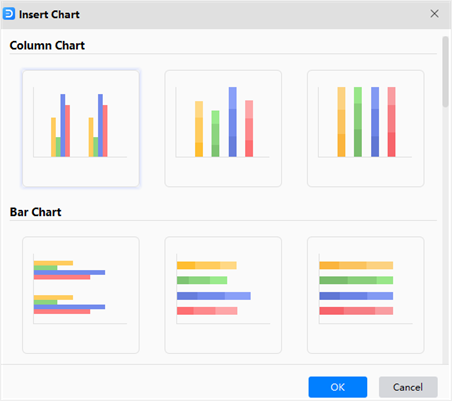
There are different types of pre-defined charts in EdrawMax:
- Column Chart
- Bar Chart
- Line Chart
- Area Chart
- Scatter Chart
- Radar Chart
- Pie/Doughnut Chart
- Gauges Chart
- Funnel Chart
To customize a chart, select the chart, click Chart icon on the right sidebar to open Chart pane. In the Properties pane, you can click Change Chart Type button to change the type of the selected chart.
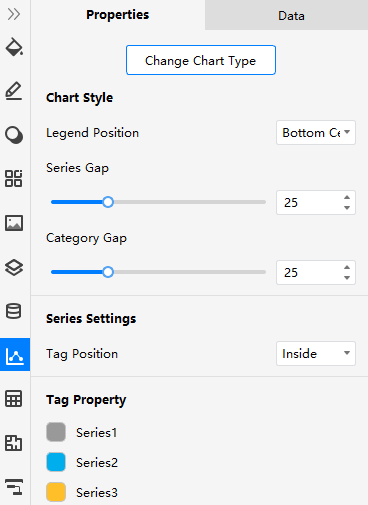
Once you insert a chart in the canvas, the Properties pane shows up and the options will be different according to the type of the inserted chart. For example, there inserts a column chart on the canvas and the right Chart pane has shown the specific properties of this chart.
On the Properties pane, the common options are:
- Chart Style
- Series Setting
- Tag Title
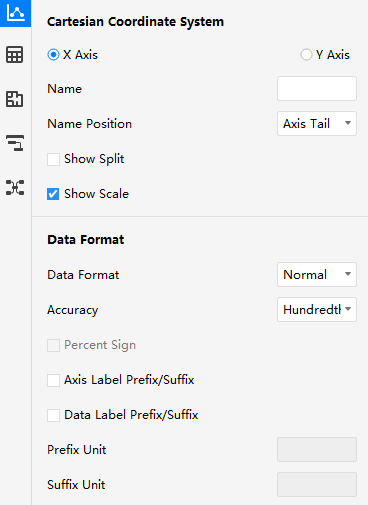
- Cartesian/Radar Coordinate System
- Data Format
In the Data pane, you can
- Import data: click Import to import the data file (xlsx, csv) that you need into the built-in worksheet.
- Export data: click Export to export the table into a file (xlsx, csv).
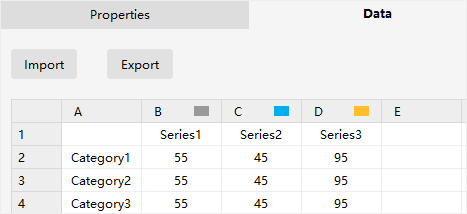
Apart from importing data, you can also input the chart data by double-clicking on the cells of the worksheet on the Data pane and typing numbers or text into them.
Watch this video to learn more. If the video doesn't play, please visit it at YouTube.
Timestamps
00:16 Insert Table
02:00 Insert Picture
03:22 Insert Chart
05:52 Insert Container
06:36 Insert Formula
07:15 Insert Vector Text
07:52 Insert QR Codes
08:22 Insert Font Symbol