How to Make a Flowchart (4 Easy Methods)
- What is a Flowchart?
- How to Use Flowchart Symbols (With Meanings)?
- Method 1: How to Make a Flowchart in MS Word/Excel/PowerPoint
- Method 2: How to Make a Flowchart in Visio
- Method 3: How to Make a Flowchart in Google Docs
- Ultimate Method: How to Make a Flowchart with EdrawMax
- Rules for Making a Flowchart
- Flowchart Templates
What is a Flowchart?
Flowcharts visually represent a process or workflow in a step-by-step manner. It breaks down a process into steps, usually in a sequential order. Each step is represented by blocks or ovals, and connected by lines or arrows.
A flowchart is most commonly used in the planning stages of a project, in order to map out the various steps in a workflow. By extension, a flowchart can be used to document, communicate, and analyse a workflow. They may also be used in more technical fields, such as programming, to illustrate data flow.
The primary benefit of flowcharts is its clarity. You are able to communicate what might be a complex process in a few simple shapes. It is also incredibly useful for improving communication and understanding amonst teammates regarding a certain process or workflow.
How to Use Flowchart Symbols (With Meanings)?
Basic Flowchart Symbols
A few of commonly-used flowchart symbols are explained here. For more information , please refer to the expandable link - flowchart symbols.

Use this shape for the beginning or ending step of your process.

This shape stands for a step in your process.
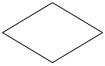
It indicates a point where the outcome of a decision dictates the next step. There can be various outcomes, but usually there are just two - yes and no.
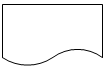
Document shape represents a step that results in a document.
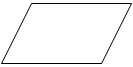
This shape shows that information is coming into the process from outside, or leaving the process. It can also represent materials and is sometimes called an Input/Output shape.

You can Use it for a group of steps that combine to create a sub-process that is defined elsewhere, often on another page of the same drawing.

This kind of shapes represents a waiting period where no activity is done. In Process Mapping, delays are often important as they may result in adding to the cost of the product or simply delaying its production.

Database
Use this shape for a step that results in information being stored.
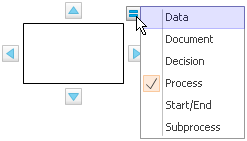
Tip: The above flowchart symbols are multi-shape with floating quick buttons. You can move the pointer over the floating quick button to modify the shape quickly. For example, when you move the pointer over the quick button of a process shape, you can change it into other common shapes by selecting Data, Document, Decision, Start/End or Subprocess buttons as shown in the figure.
How Should We Use Flowchart Symbols to Build A Flowchart
Most of us do not know how to deal with flowcharts when we are novices. However, practice makes perfect. A good flowchart helps to understand the systematic flow of information in the system. If a flowchart is not created properly, it may mislead the system designer or result in fatigue consequences. Therefore, you must create flowcharts carefully. I would always suggest you use flowcharts to make the process of a system and its flow easy to understand.
Although there are many symbols that can be used in flowcharts to represent different kinds of steps, accurate flowcharts can be created using very few of them (e.g. Process, Decision, Start, delay, cloud).
One of basic flowchart symbols is a simple action, which can be anything from striking an anvil to make a cash payment. It is represented by a box containing a description of the action. The mapping of "what follows what" is shown with arrows between sequential action boxes, as shown in the illustration. This also shows the boxes for the flowchart's start and end points, in which there are normally one for each.
Fig. 1. Basic Flowchart Elements
Processes become more complex when decisions must be made, which means a set of actions must be taken. The decision is shown in a flowchart like a diamond-shaped box containing a simple question to which the answer is "yes" or "no," as shown in Fig. 2. More complex decisions are made up of combinations of simple decision boxes.
Fig. 2. Decisions in Flowcharts
Processes often go wrong around decisions, as either the wrong question is being asked or the wrong answer is being given.
Where boxes cannot be directly connected with lines, the separated lines are coordinated with connector boxes containing matching names. This typically occurs where lines cross onto another page as shown in the illustration.
Fig. 3. Continuing Flowcharts across pages
By using multiple connector boxes, it is very easy for flowcharts to become very complex to understand. In terms of size, A one-page flowchart is perfect.
Large processes can be broken down into a hierarchical set of smaller flowcharts by representing a lower level process as a single sub-process box. This behaves like a normal action box at the higher level, but can be "zoomed into" to expose another flowchart, as shown in Fig. 4.
Fig. 4. Sub processes
An additional "action" box that can be useful when analyzing processes is the wait box, which highlights a delay (i.e. no action) like the illustration. This is a typical point where the overall cost of a process may be improved by acting, possibly on other processes, to reduce the delay.
Fig. 5. Delay flowchart symbol
Method 1: How to Make a Flowchart in MS Word/Excel/PowerPoint
How to Make a Flowchart in MS word
MS Word is a very versatile software that is globally used to make articles and documents. Learning this software is one of the basic skills and is simple to learn and use. Flowcharts are very useful to explain different topics as they give visual presentations. This guide will enable you with steps and the process of making flowcharts on MS word.
Step 1: The first step is to have MS Word open on your system. For different systems, it takes a different amount of time, so be patient. Identify the tabs labeled home, insert, design, layout, etc., on top of the window.
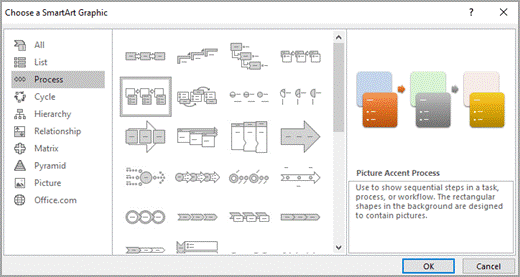
Step 2: Click on the Insert tab, find illustrations on it, and go to SmartArt in that menu. You will see the following box. Find and click “process” and choose the chart that suits your style and application.
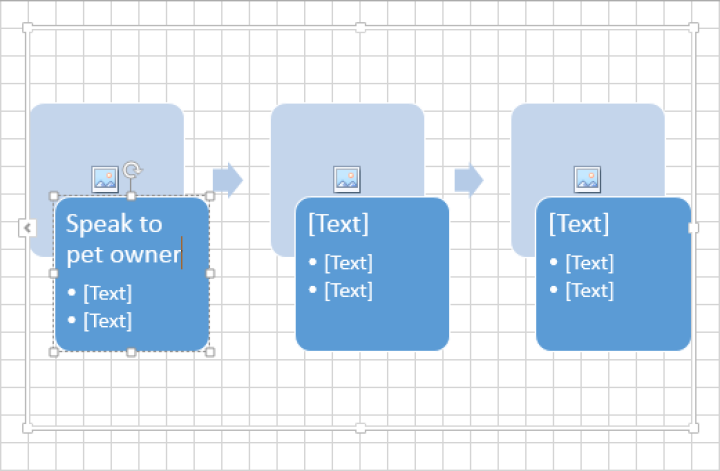
Step 3: If you want to add a picture to this flowchart, click the picture icon, select the image, and click insert.
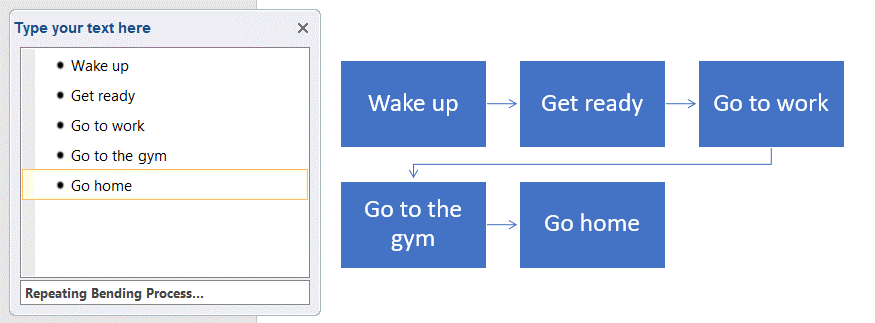
If you want to add text, there are some ways to go about it. You can click [Text] or click a box in SmartArt graphic and start writing, or you can copy from somewhere else and paste by right-clicking on [Text].
This is the basic process of making a flowchart on MS Word. After that, you can make the flowchart your own by customizing your flowchart by adding or deleting boxes, moving boxes, changing color, etc., to really portray your idea to the best of your ability.
How to Make a Flowchart in MS Excel/PowerPoint
MS Excel and PowerPoint are very powerful software that caters to different uses. Although they both have different basic uses, they can also make flowcharts for better representation and visual understanding. The process of making flowcharts on both these software is very similar. For excel, you have to form a grid by selecting an area to make it a little easier to create charts.
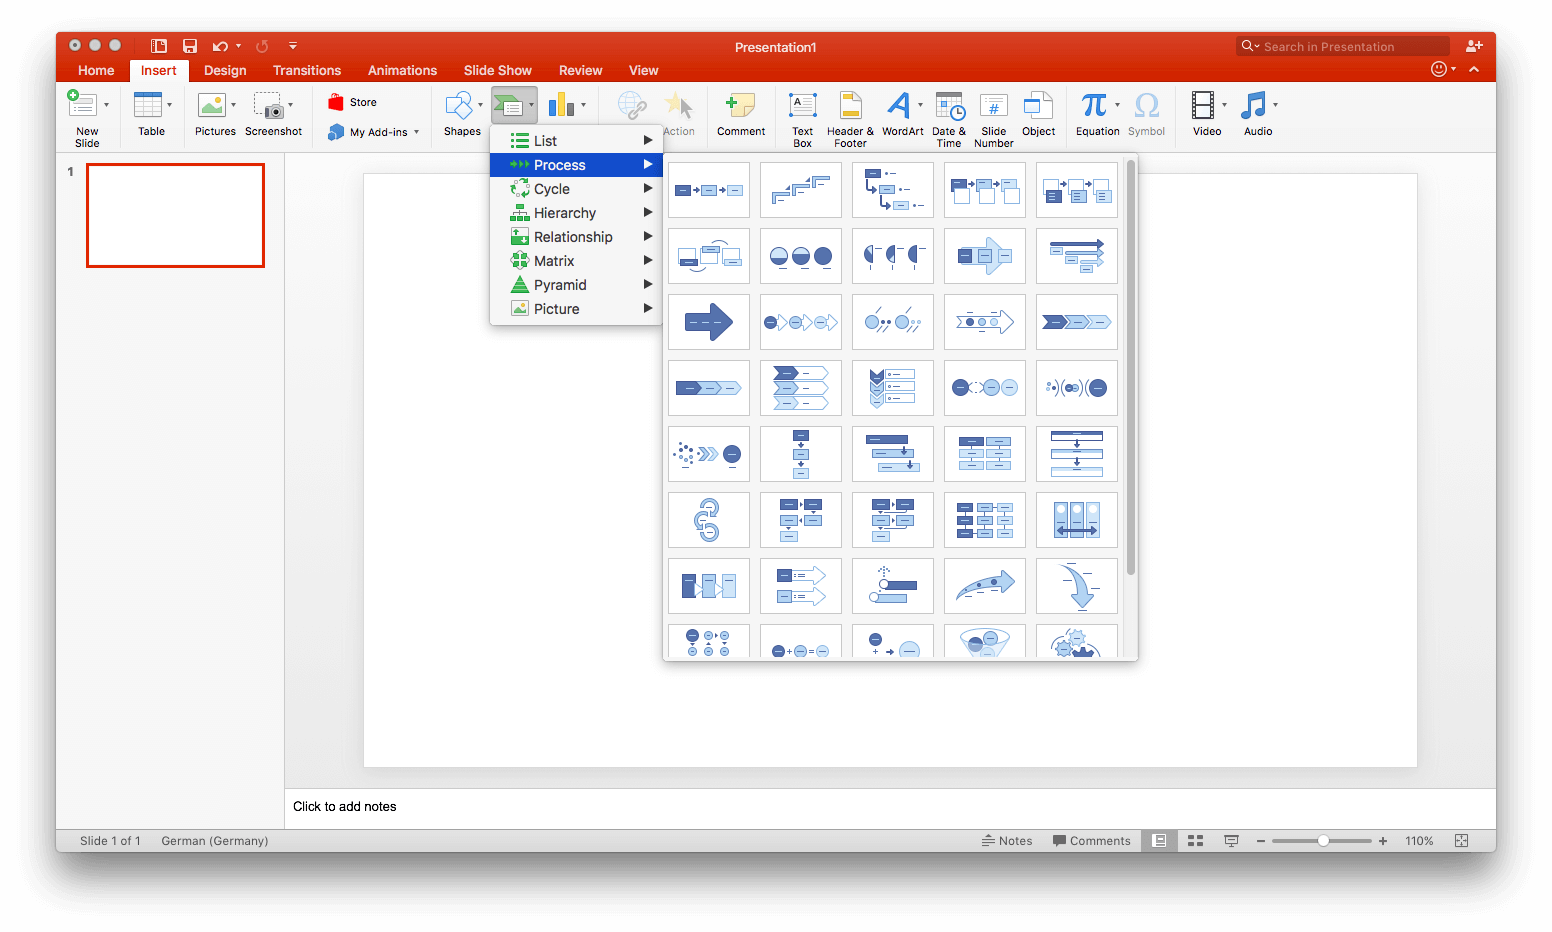
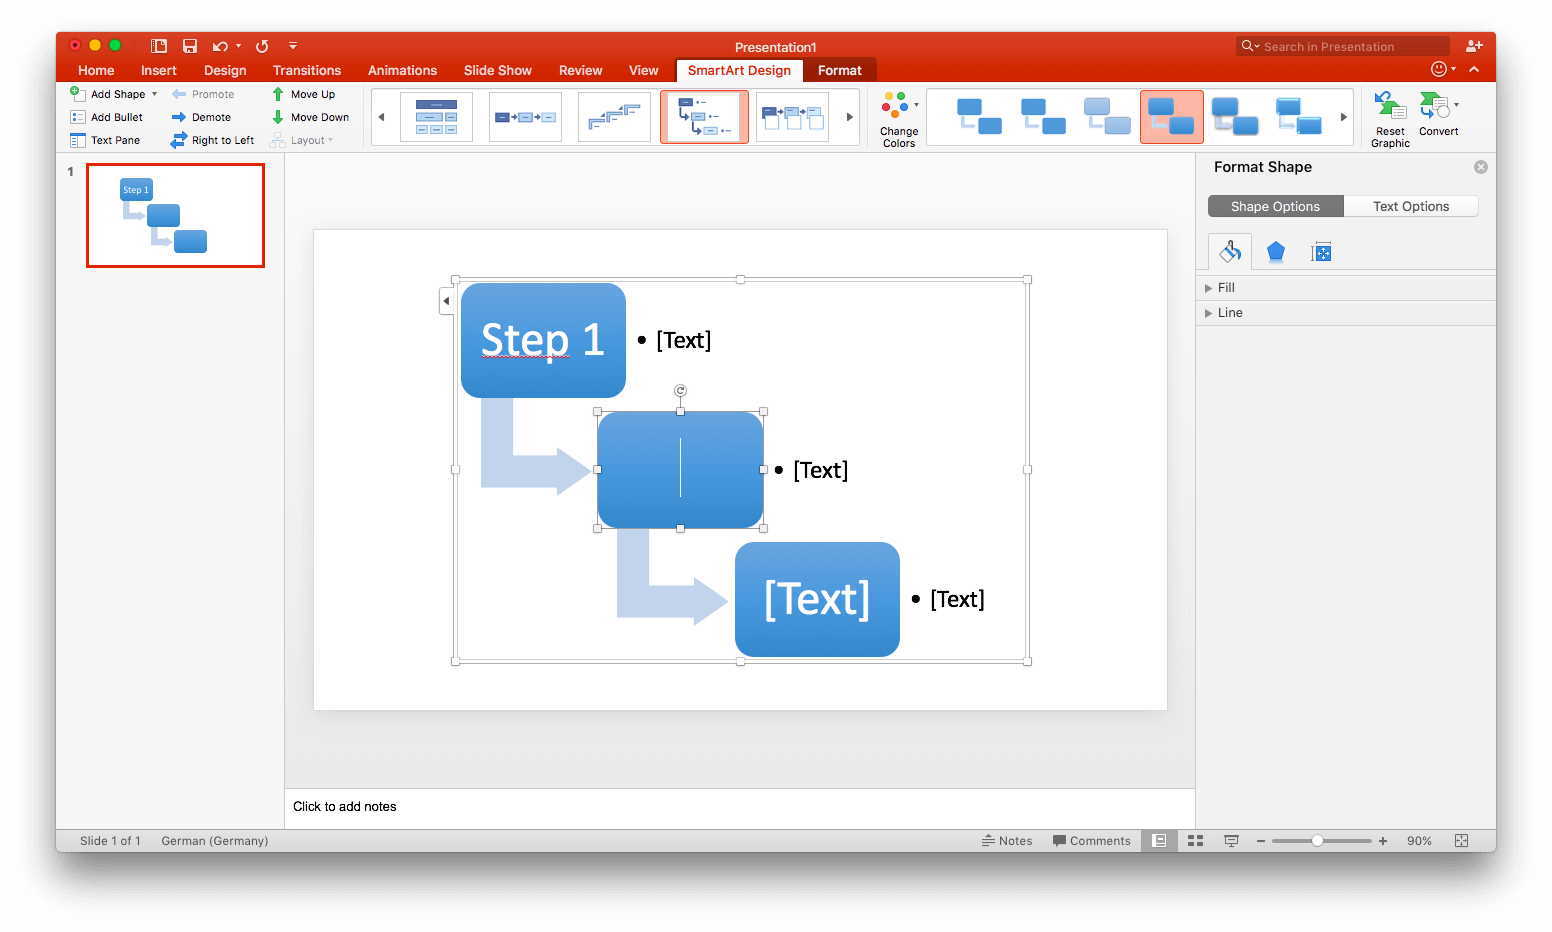
Step 1: Find the Insert tab and click on it. Click SmartArt and hover pointer on “process” to see options for flowcharts. Select the char that best suits your interests.
Step 2: The flowchart selected is completely customizable. You can add text by clicking the center of a shape. You can add shapes from the SmartArt graphic by clicking “add shape” on it.
Step 3: Customize your flowchart even further by using SmartArt design and format tabs on the toolbar.
How to Make a Flowchart in Visio
Visio is a software by Microsoft that is very proficient at producing meaningful flowcharts.
Step 1:
Step 1: Boot up Visio.
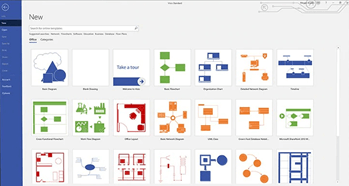
Step 2: Click the flowchart category and find the basic flowchart on it.
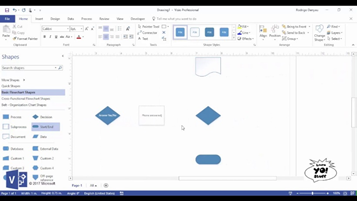
Step 3: Drag every relevant shape to the drawing board in accordance with each step of the flowchart. Connect the shapes by using the mouse pointer, use connectors to connect shapes that are not directly across.
Step 4: Add text to the shapes by selecting and typing. To finish typing, click the blank area on the screen.
How to Make a Flowchart in Google Docs
Making a flowchart on Google Docs is a relatively simple task, but it requires more work compared to the SmartArt method. We will guide you through a step-by-step process on how to make a flowchart on Google Docs.
Step 1: The first step is to open google docs on your device and running so that you can actively start work on it. Click on the blank document so that you have a completely clear page to start working on.
Step 2:
Step 2: The second step is to click on “Insert” on the upper tab. A menu will drop down, click on “drawing,” and then click on “+ new.” Following these steps in accordance will take you to a blank canvas.
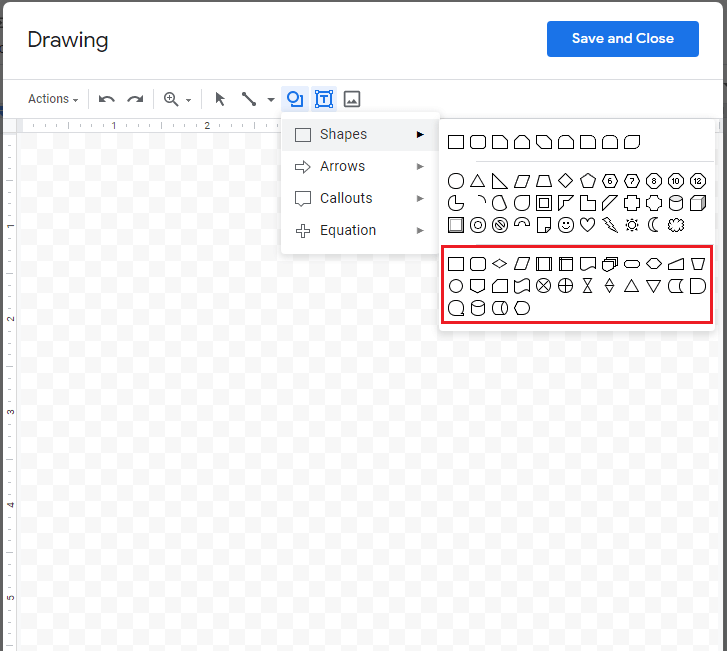
Step 3: Once the blank canvas shows up, look for the icon that looks like a circle and a square. Click on this icon, and it will drop down a menu, click on shapes which will lead you to several shapes in the inventory. Right below the shapes, the flowchart symbols are present that we will be using.
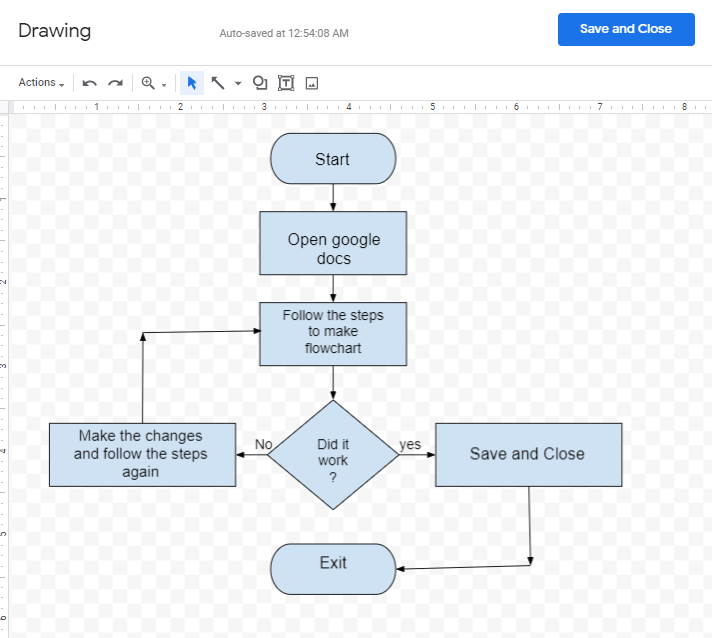
Step 4: you select the flowchart symbols you need to make your flowchart and then move on to the next step.
Step 5: we add arrows to the symbols to have a proper flow to the flowchart.
Step 6: After the arrows have been added, the next step is to add text to the flowchart. The text is the most important part as it gives identity to the flowchart.
Ultimate Method: How to Make a Flowchart with EdrawMax
With the professional flowchart software - EdrawMax, it will be easy for you to create a high-quality flowchart on your own. Even through you don't have any drawing skill. Follow the steps below and try to make a flowchart in EdrawMax.
Step 1: Download EdrawMax desktop software or open EdrawMax web-based application.
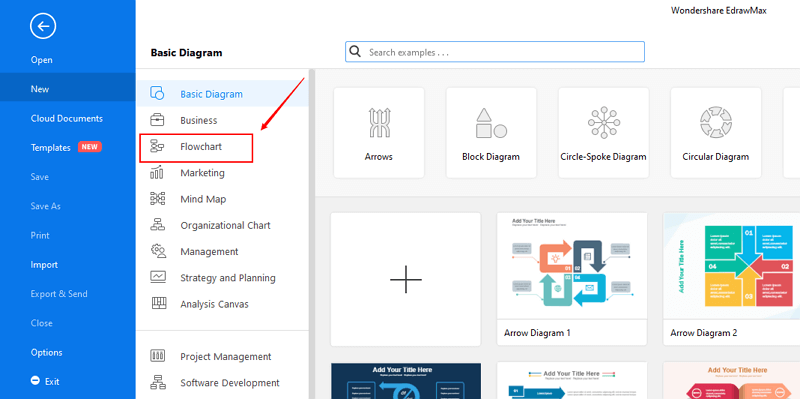
Step 2: Navigate to [New]>[Flowchart]>[Basic Flowchart].
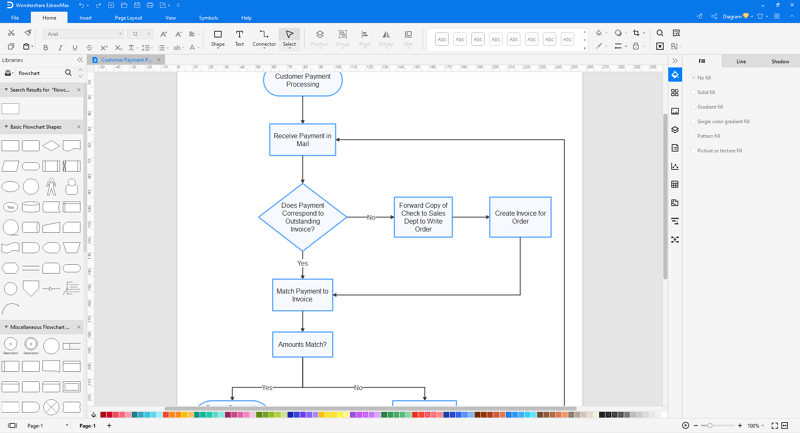
Step 3: Select one flowchart template to edit on it or click the [+] sign to start from scratch.
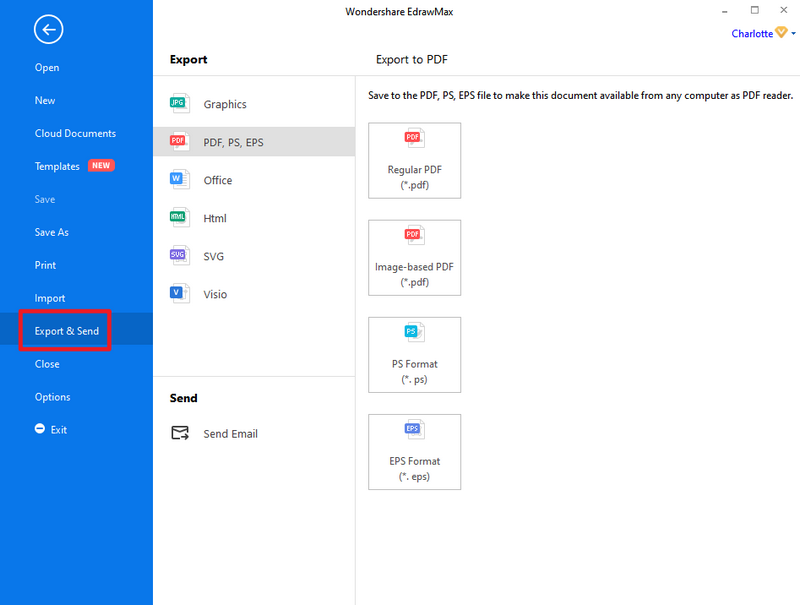
Step 4: You can export the file to Graphics, PDF, editable MS Office file, SVG and Visio vsdx file.
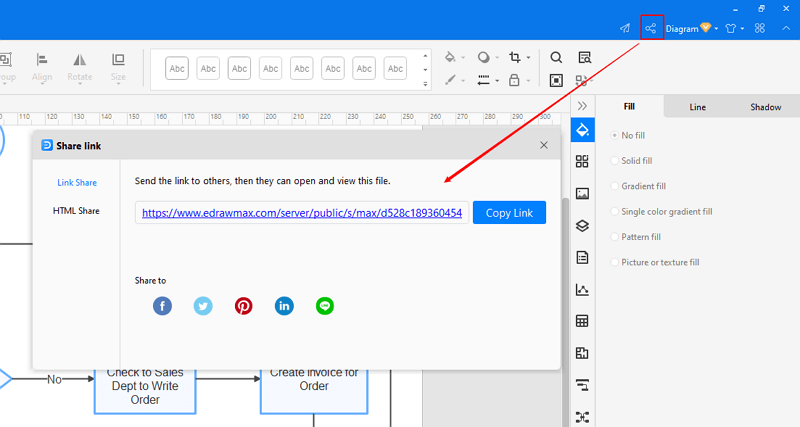
Step 5: And you can share your diagram with others via social media and online website page.
EdrawMax
All-in-One Diagram Software
- Superior file compatibility: Import and export drawings to various file formats, such as Visio
- Cross-platform supported (Windows, Mac, Linux, Web)
Rules for Making a Flowchart
Still feel confused about how to draw a flowchart? Here are some guidelines and tips that can be used to simplify the process of creating a high-quality flowchart.
- Agree on standard flowchart symbols as there are several conflicting common uses.
- Draw a start box at the top of the work area.
- Add the first box below the start box, identifying the first action simply by asking, "What happens first?". Add an appropriate box around it.
- Add subsequent boxes below the previous box, identifying each action by asking, "What happens next?". Draw an arrow from the previous box to this one.
- Describe the process to be charted.
- Start with a trigger event.
- Note each successive action concisely and clearly.
- Go with the main flow (put extra details in other charts).
- Make cross references to support information
- Gather the team who are to work on describing the process. These should include people who are intimately involved in all parts of the process, to ensure that it gets described as it actually happens, rather than an idealized view.
- Follow the process through to a useful conclusion (end at a target point).
- If the final diagram is to be used as a part of a formal system, make sure that it is uniquely identified
- Define the process boundaries with starting and ending points.
- Complete the big picture before filling in the details.
- Clearly define each step in the process. Be accurate and honest.
- Identify time lags and non-value-adding steps.
- Circulate the flowchart to other people involved in the process to get their comments.
Flowcharts don't work if they're not accurate or if the team is too far away from the process itself. Team members should be real participants in the process and feel free to describe what really happens. A thorough flowchart should provide a clear view of how a process works. With a completed flowchart, you can:
- Identify time lags and non-value-adding steps.
- Identify responsibility for each step.
- Brainstorm for problems in the process.
- Determine major and minor inputs into the process with a cause and effect diagram.
- Choose the most likely trouble spots with the consensus builder.
Flowchart Templates
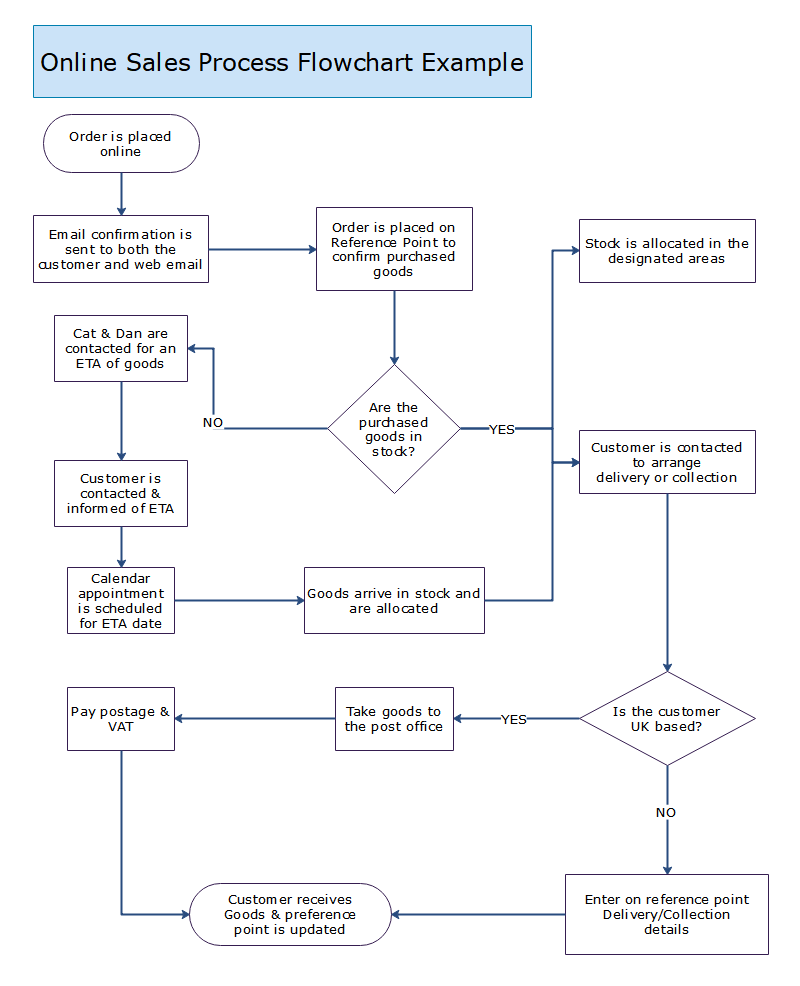
Example 1: Online Sales Process Flowchart
Online Sales Process Flowchart is the visual representation of the entire process that goes in selling a product online by any company or organization. Check out the image to learn more about the aspects of the online sales process flowchart, and one process is dependent on the other.
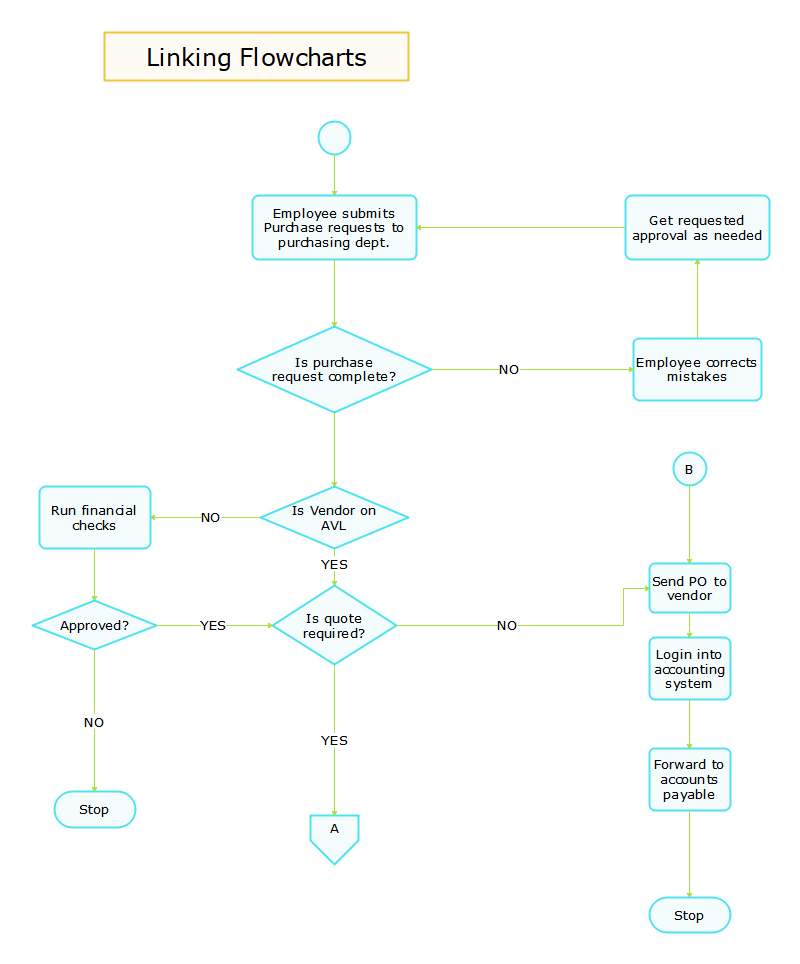
Example 2: Linking Flowchart
To understand a company’s business flowcharts, users prefer to show business processes or workflows. In order to understand more about a company’s process, the big flowcharts are broken down into smaller ones and can later be linked to complete the entire process.
See and download more free flowchart templates.