Simple Histogram Maker - Make Great-looking Histogram
Introduction to Histogram
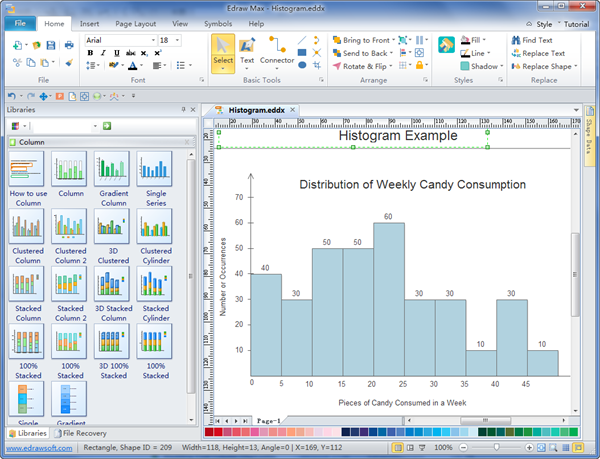
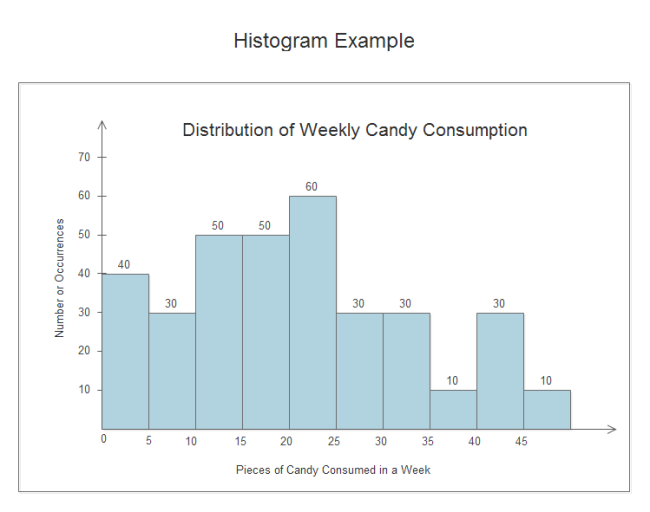
Histogram is a chart representing a frequency distribution; heights of the bars represent observed frequencies. In other words a histogram is a graphical display of data using bars of different heights. It is similar to bar chart but it uses vertical column to display data. Unlike horizontal and vertical bar charts, the x-axis is not divided into mutually exclusive categories. The x-axis is a continuous scale. To construct a histogram, a section of the number line is divided into equal chunks, called bins. Note that for a histogram, the bins all must be the same width. Refer to the following diagram for better understanding of histograms.

Discover why Edraw is an awesome histogram maker: Download it Now.
Simple Histogram Maker - Make Great-looking Histogram
Edraw's histogram maker is used to show data visually, helping you organize your thoughts and simplify statistics analysis. It provides professional and infographic visuals to your graphs so that your presentation can be more persuasive. For those already accustomed with other Microsoft programs such as Word or Excel, the interface will be pretty intuitive. Simply drag and drop symbols, apply built-in designed themes, and automatically share your finished histogram into a presentation or PDF with one click.
System Requirements
Works on Windows 7, 8, 10, XP, Vista and Citrix
Works on 32 and 64 bit Windows
Works on Mac OS X 10.2 or later
Attributes of Edraw Histogram Software
1. 1-click Creation
1-click creation cuts down 5 actions in traditional drawing software to 1 click
action. That is 5 times faster! Marvelous!
2. Quick-start Templates
Included are some histogram templates available to Edraw users. They will not
only get you going quickly but guide you to create beautifully effective and
presentation-quality histogram. Our diagramming community keeps adding
templates every day. So you're sure to find something suitable to you.
3. All Necessary Symbols
Our object library comes with an awesome set of objects making it super easy to
create histogram.
4. Easy to Understand Graphic Results
We got beautifully designed icons for visually pleasing and comprehensible
histogram. Sometimes, vivid pictures can maximize the impact on audience,
which cannot be achieved by just words or numbers.
5. Linkable Diagrams
The hyperlink function enables you to design histograms with working links.
That means you can link to web pages or other files from your diagram. This
makes it very easy to navigate back and forth between the relevant information.
Thus, you can avoid confusion and saves a mass amount of time spent on redoing
things.
6. Editable SVG Exports. Works Everywhere.
As a vector-based software, Edraw exports diagrams as SVG documents which can
be styled and modified using Vector editors like Adobe Illustrator and Inkscape.
The exported editable SVG files are fully fledged documents that can be viewed
in any web browser as well as be imported into Microsoft Visio. One file format,
infinitely accessible! Great!
Histogram Template

Best Tips to Create Effective Histograms
Creating a histogram is an effective way of displaying univariate data in a visual way that reflects the data's frequency distribution. There are several variables to consider when creating histograms. To gain the optimal histogram, one needs to carefully consider the nature of the data, the analysis of the data, the preferences of the target audience, and software or resources available.
To prepare well, it is important to think about the nature of the data to be analyzed. Histograms are usually applied to show the distribution of univariate data sets. More specifically, histograms are a visual representation of the data's frequency distribution or probability density function. It is advisable for one to consider whether a histogram can represent the data best before constructing it.
If a histogram is exactly the best chart for representing the data, the next thing for consideration is the target audience. Teachers, engineering managers and businessmen may all have different expectations and demands. In all cases, easily readable labels on the axes and neat, precise construction are desirable.
Software packages can be used for creating a histogram quickly to save time and effort. Modern statistics programs offer a variety of services that extend beyond the construction of the histogram itself. These programs can produce color histograms and 3D infographics histograms. For professional work, Edraw charting software package is one of the ideal options because of its added sophistication in data analysis and the enhanced presentation.