Gauge Chart Maker - Make Great-looking Gauge Chart
Discover why Edraw is the simplest and easiest, yet most powerful gauge chart maker: Download it Now.
Gauge Chart Definition and Usage
A gauge is a device that measures the amount or quantity of something and shows the amount measured. A chart containing the image of gauge can present data more vividly so that audience can comprehend the data at a glance. By displaying several gauges together indicating a series of number, users can show the trend intuitively. A chart containing the image of gauge can present data more vividly so that audience can comprehend the data at a glance. By displaying several gauges together indicating a series of number, users can show the trend intuitively.
It can be used widely in dashboards, real-time monitors and reports and so forth, displaying Key Performance Indicators (KPIs), progress indicators and quantity indicators. For instance, we can apply it to display cost per acquisition in a management dashboard. The bulb gauge is a special gauge used to reflect a single state using pre-defined color. For example, it can monitor the overall condition of a furnace so that it can raise an alert when the temperature becomes too high by turning into red color.
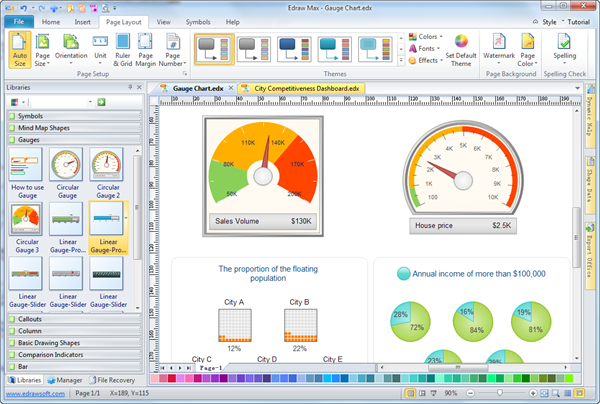
Simple Gauge Chart Maker - Make Great-looking Gauge Charts
Edraw Gauge Chart maker is finely designed to produce stylish and professional gauge charts from templates. For people already accustomed with other Microsoft apps, such as Word or Excel, the interface will be quite familiar. Simply drag and drop symbols, import the data, apply built-in designed themes, and automatically share your finished gauge chart into a presentation or PDF by only one click.
System Requirements
Works on Windows 7, 8, 10, XP, Vista and Citrix
Works on 32 and 64 bit Windows
Works on Mac OS X 10.2 or later
Top Features Making Edraw the Premier Chart Maker
- An automated Charting Software which allows you to create Gauges / Speedometer, Charts, and Maps out of your Excel Data with one click of a button.
- A complete all-in-one package making solutions tailored to the needs of all drawing types. Over 200 diagram types are supported, including pie, line, doughnut, bar chart and so on.
- Fancy printable and editable templates for immediate use or a jump start.
- Fully compatible with MS programs so that your charts are always ready-to-publish online - great for websites, presentations, sharing information on your intranet
Smart Gauges Chart Symbols
A group of vector gauge chart symbols with smart features are offered for fast and fun design.
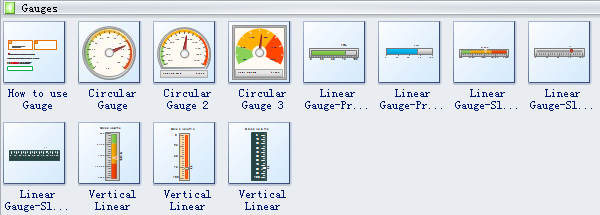
Drag the Gauge shape needed directly onto the drawing page. Instead, you can also click its icon and then click on the location where you want to place it.
Use the point-and-click editor to modify shape instantly.

Gauges Chart Examples
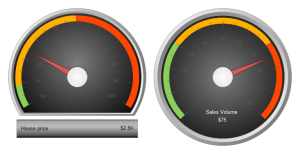
Anyone can make a professional-looking gauge chart without hassle with the help of this simple vector template.