Gantt Chart in Edraw Max, MindMaster and Edraw Project
Gantt Chart in Edraw Max
Features of Gantt chart
- Create Gantt chart from the library templates
- Support data interactive
- Allow to convert to a mind map or a timeline diagram from the Gantt chart
- Use the icons on the menu bar to control and move the progress bar
- Export Gantt chart to Graphics, TIFF, PDF, PS, EPS, Office Word, Office PowerPoint, Office Excel, HTML, SVG, VSDX
Edraw Max is an all-in-one diagram software for creating 280+ diagrams including Flowchart, Network Diagram Org Chart, Mind Map, Floor Plan, Project Chart, Electrical Schematics, P&ID, UML, Fashion Design, Certificate and so on. In Edraw Max, the Gantt chart is one of the drawing functions in Project Management Template.
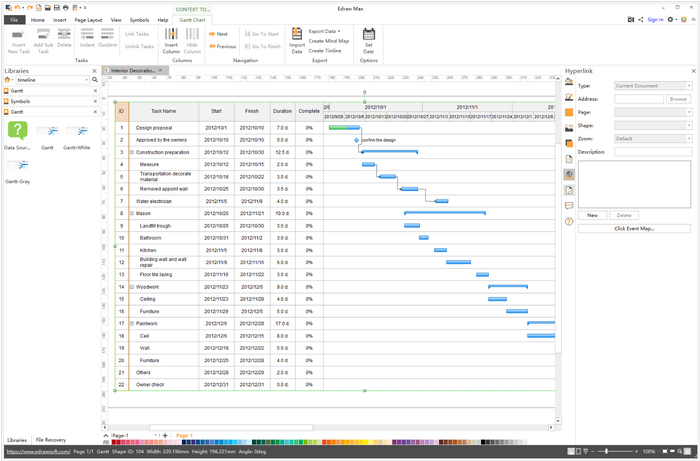
When you open the Gantt chart template and drag the sample from the library to the page, a Gantt Options Setting will pop up for date setting. From the menu bar, user can add and delete tasks or make tasks indent to become a subtask; and can select two tasks to add dependency between them through "Link Tasks" or just drag them to link together. If you want to view the progress bar, then click the "Next", "Previous", "Go to Start/Finish" to move it.
In Edraw Max, you can export a Gantt chart to an editable Excel, Txt, CSV format and also you can import these files to auto-create a Gantt chart in Edraw Max. What is more, you can create a mind map or a timeline diagram from the Gantt chart directly.
Gantt Chart in MindMaster
Features of Gantt chart
- To generate a Gantt chart from the mind map
- Changes made on Gantt chart sync in mind map, vice versa
- Task date period, progress, priority, the resource can show on the mind map
- Allow to view both Gantt chart and mind map at the same time and to edit on one of them
- Export Gantt chart to PDF
MindMaster is a professional mind map software fosr Linux, Windows, Mac, iOS and online. Users can easily create mind maps and do brainstorming with MindMaster. The traverse and full-screen slide show features are popular among presenters users.
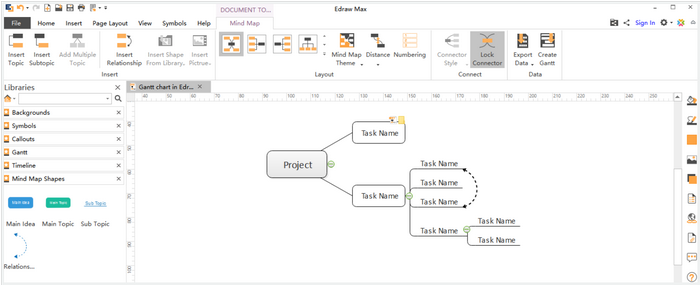
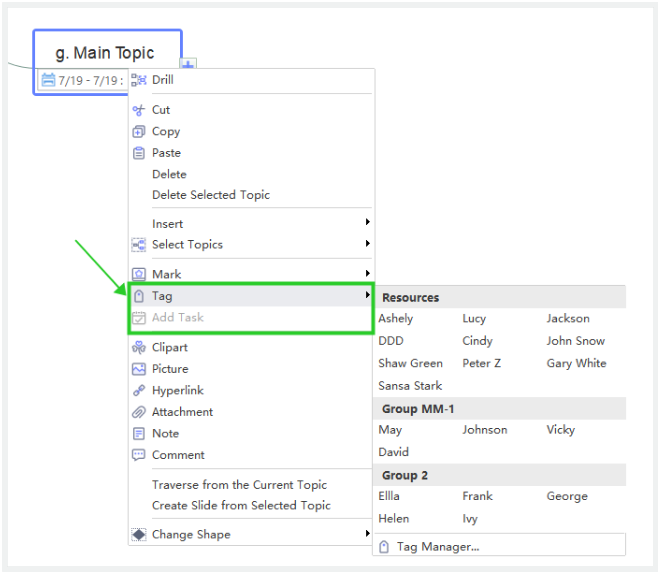
Since MindMaster is a mind map software, to use it to create a Gantt chart means to create a mind map first and then to convert the mind map into a Gantt chart. User can list projects, tasks in the mind map in a hierarchical relationship which shows accordingly in the Gantt chart too. Generally speaking, the main idea is the project and the topics are the tasks. When you edit on a mind map, you can select the topic and right-click to add a task and to assign resource for the task. Meanwhile, You can also edit the data on the view panel after you open the Gantt chart view. In the two-chart view mode, if you edit on one chart, the changes sync on another one.
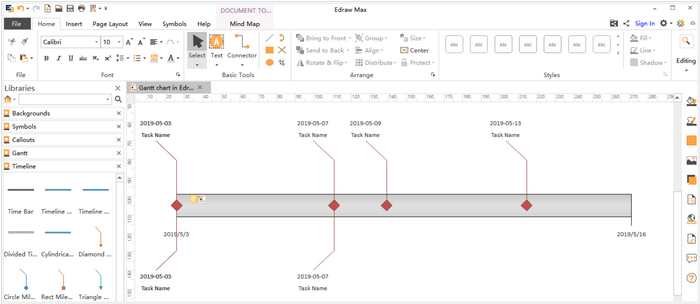
In MindMaster, a very convenient feature is that you can choose specific nodes to show in the Gantt Chart view. When you finish, you can export the Gantt chart to PDF format file.
Gantt Chart in Edraw Project
Features of Gantt chart
- A professional Gantt chart tool
- Special designed features and quick information panel for Gantt chart making
- Use shortcut key to create Gantt chart
- Various view options to the Gantt chart
- Different reports based on the Gantt chart
- Export Gantt chart to PDF and Excel
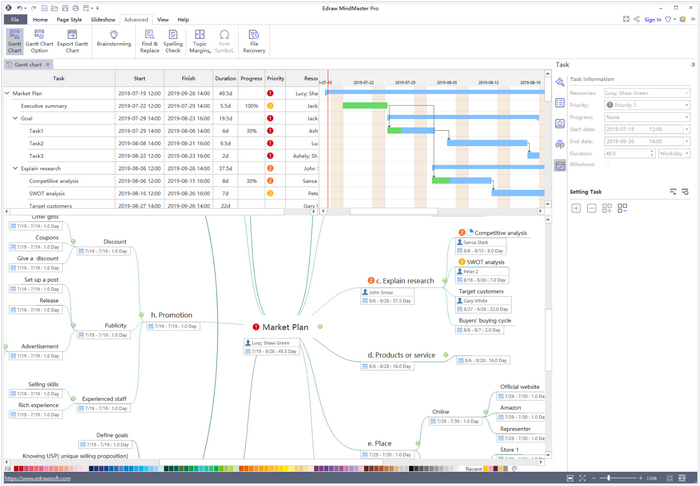
Edraw Project is a professional project scheduling software that utilizes a Gantt chart to help users manage and plan for their projects. With it, users can schedule tasks, allocate resources, track progress, and record cost.
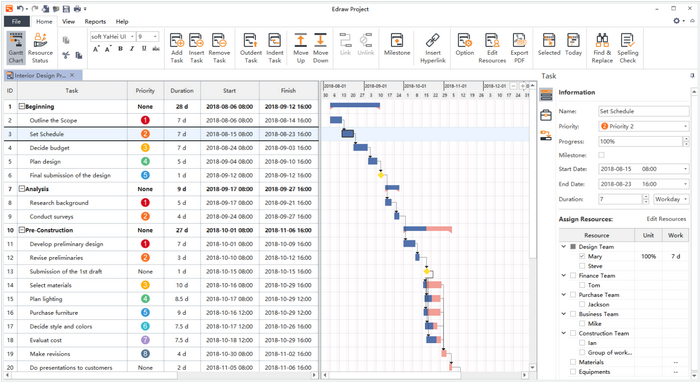
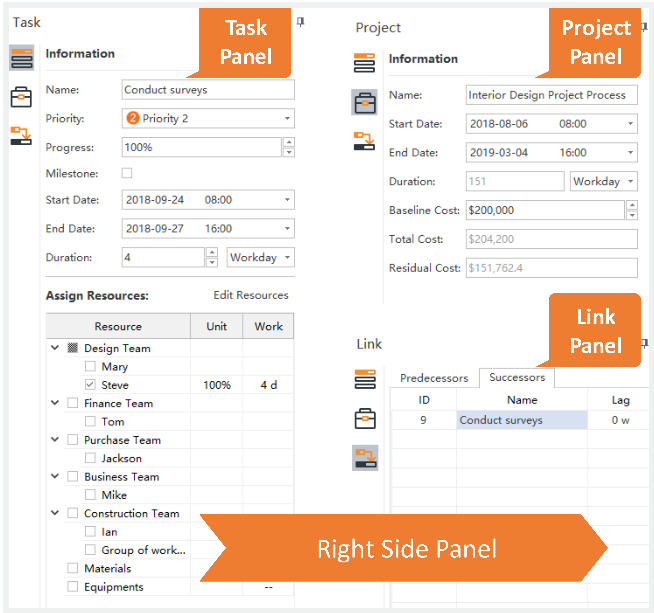
It's easy for anyone to create a Gantt chart in Edraw Project. First, to add and edit the projects and tasks on it, you can also use the "Enter" key to add tasks. The default start and end date will be today. To select the column you want to display, the default setting for each line are: ID, Task, Start, Finish, Duration, Progress(%), Priority, Resource. And you can add others like Hyperlinks, Cost, Work (hours/days), Remaining Cost, Early Start, Early Finish, Late Start, Late Finish and so on and then to adjust their order in Column Manage. Besides, you can adjust the time interval by simply clicking the "+" & "-" icons on the progree bar. Also, on the right side, there are three information panels for editing "Task", "Project" and "Link" information.
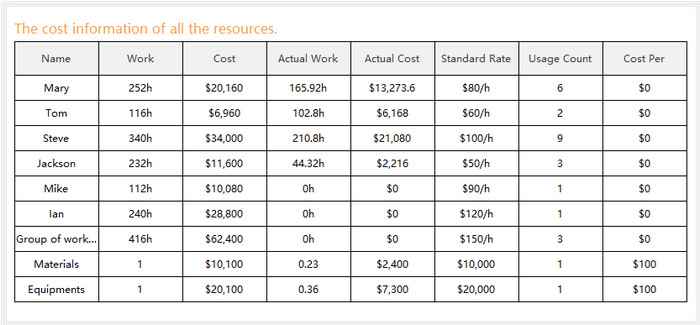
In Edraw Project, there are many view methods for a Gantt chart. You can view all the outlines of the tasks and expand all the tasks in several clicks. And you can get several reports based on this Gantt chart, such as resources report, critical task report, top-level cost report and so on. Finally, you can export the Gantt chart to both PDF and Excel format files when you finish the diagram.
So far, we can see that the Edraw Project is an efficient project management tool with UI and features specially designed for project schedule management.