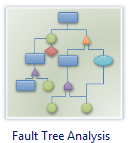
Fault Tree Diagram Software
Introduction to Fault Tree Diagram
Understand what is likely to happen in the future is prerequisite to make wise plans and decisions. Designers and analysts have to make better-informed risk assessment decisions based on evaluations of the risks and results related with alternative designs and other risk-mitigating actions.
Fault Tree Analysis can help address the ways of undesirable events could occur by providing you with data showing how and under what circumstances the catastrophic failure or hazards could occur. it is a graphical representation of the major faults or critical failures associated with a product, the causes for the faults, and potential countermeasures. The tool helps to identify areas of concern for new product design or for improvement of existing products. It also helps users identify corrective actions to correct or mitigate problems.
Fault Tree Diagram Software
Edraw Max is a vector-based diagramming software with rich examples and templates. It is easy to create fault tree diagrams to document business processes. Create diagrams that document events that might lead to failure so that failures can be prevented.
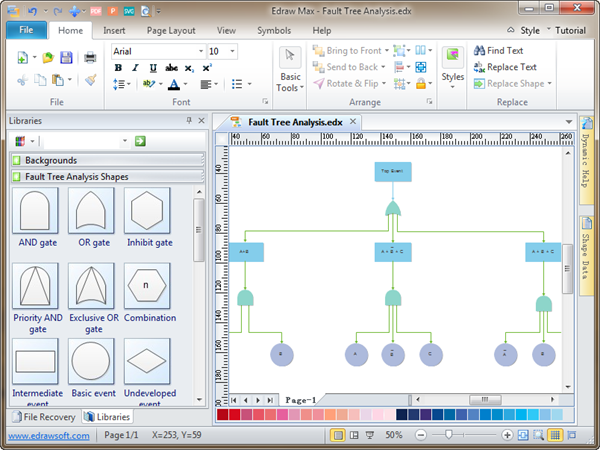
Free Download Fault Tree Analysis Software and View All Examples
System Requirements
Works on Windows 7, 8, 10, XP, Vista and Citrix
Works on 32 and 64 bit Windows
Works on Mac OS X 10.2 or later
Compatible with Linux distributions such as Debian, Ubuntu, Fedora, etc
Software Features - Why Apply Edraw Fault Tree Software
Edraw has built its reputation on the efficiency, precision, stability and
ruggedness of its Fault Tree products. That is why millions of Edraw have been
installed all over the world, which are presently being used in major projects
of many fields as varied as education, fashion, aerospace, defense, rail,
chemical process plant, oil & gas and medical amongst many others. On top of
these is the user-friendly interface allowing simple creation or adjustment of
projects.
• Up-to-date, intuitive and advanced fault tree diagram interface facilitates
full control over the diagram: elements layout, themes, colors, styles, zooms,
etc.
• Handy tools for diagram printing and simple Copy & Paste transfer to other
applications
• Automatically built Fault trees
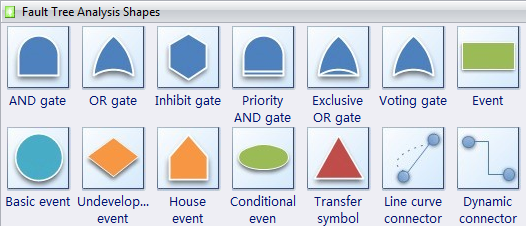
• Easy to use Events and Gates Library
• Smart presentation allows for editing in full screen so that explanation can
be more detailed
• Both qualitative and quantitative analysis of data
Built-in Shapes for the Fault Tree Diagram
Create Fault Tree diagrams to document business processes. Document 6 Sigma and ISO 9000 processes.
Fault Tree Diagram Examples
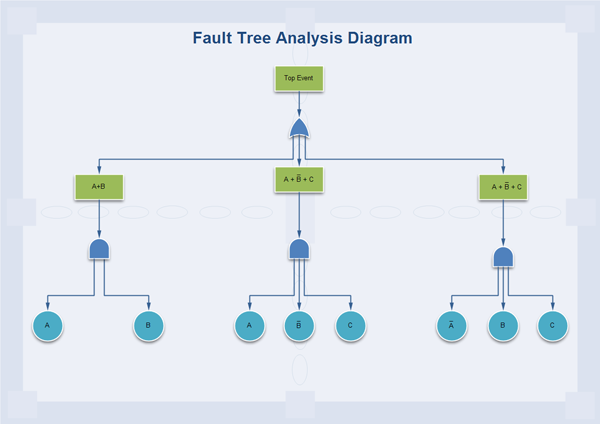
Suppose that we visit the courthouse in a certain town, and we observe people who stop at the office of the local justice of the peace to register their marriages. Let A be the independent probability of finding in the office an adult woman who is going to get married (i.e., female spouse), while B is the probability of finding a marrying adult man (i.e., male spouse). We disregard any liaison between staff members who are employed in that office in order to be free of bias in our experiment.
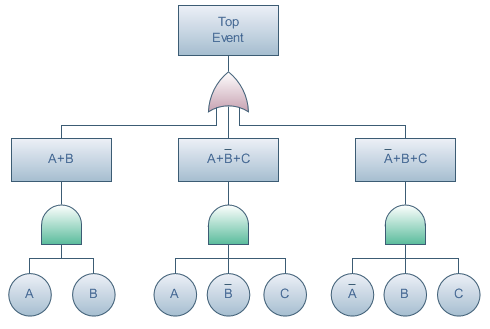
Fault Tree Template
The following fault tree diagram was created and included in the Edraw example gallery.
How to Use Fault Tree Diagram
Create professional-looking Fault Tree diagram from examples and templates with Edraw. Please click here to download Fault Tree Analysis Software. Then you can use the built-in Fault Tree templates to create and present your business process with ease and effect.
- Select a component for analysis. Draw a box at the top of the diagram and list the component inside.
- Identify critical failures or "faults" related to the component. Using Failure Mode and Effect Analysis is a good way to identify faults during quality planning. For quality improvement, faults may be identified through Brainstorming or as the output of Cause and Effect Diagram.
- Identify causes for each fault. List all applicable causes for faults in ovals below the fault. Connect the ovals to the appropriate fault box.
- Work toward a root cause. Continue identifying causes for each fault until you reach a root or controllable cause.
- Identify countermeasures for each root cause. Use Brainstorming or a modified version of Force Field Analysis to develop actions to counteract the root cause of each critical failure. Create boxes for each countermeasure, draw the boxes below the appropriate root cause, and link the countermeasure and cause.
When to use Fault Tree Analysis
Fault tree analysis is useful both in designing new products/services or in dealing with identified problems in existing products/services. In the quality planning process, the analysis can be used to optimize process features and goals and to design for critical factors and human errors. As part of process improvement, it can be used to help identify root causes of trouble and to design remedies and countermeasures.
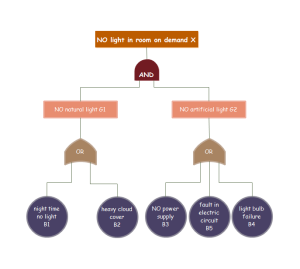
Fault Tree Analysis Example
Quickly Learn Fault Tree Analysis Key Points
Business Process Model Software