Doughnut Chart Software
Introduction to Doughnut Chart
Doughnut chart is a kind of circle chart similar to pie chart. The only difference between them is that the doughnut chart has empty space in the middle. The primary strength of a donut chats is that it can visualize several series of data on only one chart.
Automatic Doughnut Chart Software
Edraw Doughnut Software helps to present and communicate data and information dynamically. You can easily collect, archive, organize, analyze, visualize and report complicated data in no time. Try it to make doughnut charts as attractive as real doughnuts.
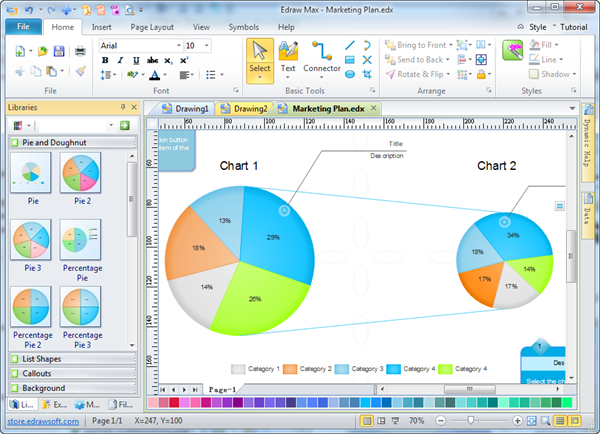
Discover why Edraw is an awesome chart maker: Try it FREE.
System Requirements
Works on Windows 7, 8, 10, XP, Vista and Citrix
Works on 32 and 64 bit Windows
Works on Mac OS X 10.2 or later
Features of Edraw Doughnut Software
- Highly efficient and scalable infrastructure for management of constantly streaming data;
- Cutting-edge user applications for organization, visual analysis and report of operational, asset health and management related information;
- Consolidation of disparate data sources into a highly scalable data management platform;
- Easy change of data by dragging and dropping the diamond handle;
- Automatic alteration of percentage after changing the category number or section area;
- Textbox automatically occurs after editing a category's value for more detailed description;
- High precision with configurable number of decimal places to show values.
In a word, doughnut chart helps to demonstrate the changes of data into its constituents. With Edraw's wide variety of pre-drawn doughnut graph examples and over 6000 symbols, charting couldn't be easier!
It works at the following doughnut graphs:
Using Edraw is an easy way to design doughnut graph, percentage doughnut, multi-pie graph, multi-level doughnut and more.
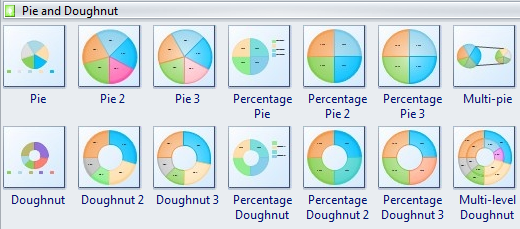
Doughnut chart shows the relationship between parts and a whole; however, it can contain more than one data series.
Doughnut displays data in rings, where each ring represents a data series.
Multi-level doughnut is like an exploded pie chart, but it can contain more than one data series.
Set Chart Data Extremely through Point-and-click Editor
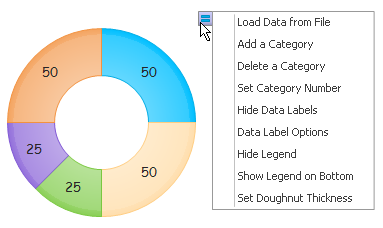
The first way to set chart data is loading data from file. You can copy the example text included in the User Guide to newly created text (.txt) file, save the source data, select a bar chart shape, and click floating menu Load Data from File to load the text file.
The second way to set doughnut chart data is edit the data labels and click floating menu to change its setting. With the point-and-edit editor, the doughnut chart can be edited extremely quickly since the shape will change automatically according to the data entered.
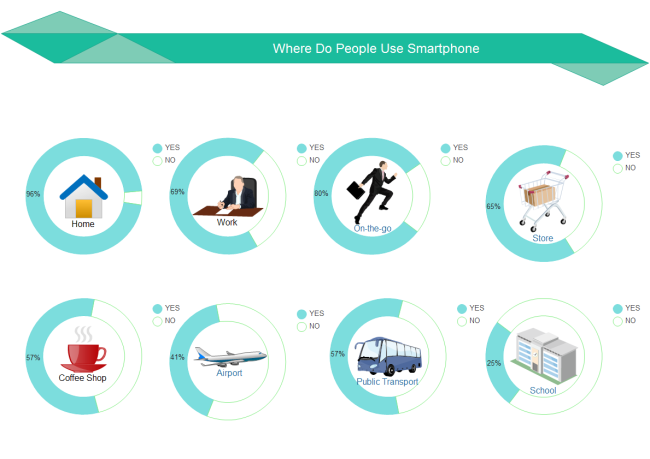
Doughnut Chart Examples
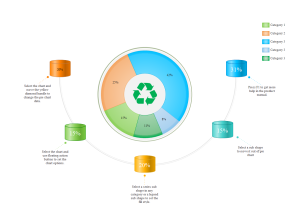
To conclude, a doughnut chart template is the best way to display all aspects of this solution's benefits for your own designs.

