Data Flow Diagrams
Businesses are built on systems, and within each system resides a process or processes and are essential for an effective business operation. However, these processes rely on data, and this data has to be analyzed and managed accordingly. Therefore, a data management tool will prove essential whether you are implementing a new system or improving an existing one.
Data transformation in a system can be expressed in different ways, and one of them is by using a Data Flow Diagram (DFD). This management tool is ideal for finding redundancies within your system and, more importantly, optimizing your system’s speed and responsiveness. This tool is the best because it gives you a better and efficient way to analyze your system’s data flow.
Learn the essentials of data flow diagrams in this article which include:
What is a Data Flow Diagram?
A Data Flow Diagram (DFD) is a way of visualizing the information that flows through a process or a system. It is considered to be a traditional way to visualize data flows within a system.
A DFD can therefore be automated, manual, or a combination of both but has to meet the graphical representation requirements of a specific system.
Purpose and Benefit
Data flow diagrams have multiple applications and benefits, and more importantly, they have universal appeal. Here are some of the major applications of DFDs.
Purpose of DFDs
- System analysis: With DFD, you can analyze and understand how a system should work before designing a database.
- Database designing: A compressive and complete data flow diagram can help you come up with the overall database design.
- Error detection: A DFD can also allow you to scan the system in case of any issue with your system.
- Decision-making: A database goes through several stages before deployments, such as creation and implementation. Within all these stages exist a ton of decisions to be made, and a DFD can help with that.
Benefits of DFDs
- It can help is drawing realistic comparisons with the real-world entities when analyzing things like input and output entities.
- It provides accurate and precise data flow representation without including any unwanted entities
- It can be used in almost every system to depict data flow thanks to its universal use
- Helps with organization management by aiding you to understand logic and concept behind the system easily
Data Flow Diagram Symbols
The good thing about DFDs is that they are easy to make since they use a few and easy to understand symbols. These symbols represent entities and the flow of data.
Process symbols: These symbols represent the system’s action on input data which results in outputs. It can be related to creation, modification, storing, deletion, or any other action on data. These symbols represent the process
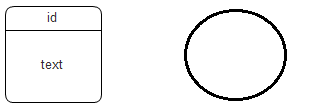
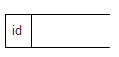
Database symbols: This is data stored in a system that can also be used as the process input and output.
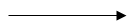
Data flow symbols: to show the direction flow of data between different entities or databases.
Entities symbols: Used to represent the source or the termination of the DFD.

When to Use a Data Flow Diagram
The DFD is an excellent communication tool for analysts to model processes and functional requirements. One of the primary tools of the structured analysis efforts in 1970s was developed and enhanced by the likes of Yourdon, McMenamin, Palmer, Gane and Sarson. It is still considered one of the best modeling techniques for eliciting and representing the processing requirements of a system.
Used effectively, it is a useful and easy to understand modeling tool. It has broad application and usability across most software development projects. It can be easily integrated with data modeling, workflow modeling tools, and textual specs. Together with these, it provides analysts and developers with solid models and specs. Alone, however, it has limited usability. It is simple and easy to understand for users and can be easily extended and refined with further specification into a physical version for the design and development teams.
The different versions are Context Diagrams (Level 0), Partitioned Diagrams (single process only -- one level), Functionally decomposed, leveled sets of Data Flow Diagrams.
What to Do before Creating a Data Flow Diagram
Before designing a data flow diagram, there are several things you should know -the rules for creating DFD. The rules state that:
- Every data must be flowing from or to a process
- Label all entities using lower case initials/letters
- Each process in a system must transform data
- The data flow in a system cannot cross each other
- Output flows rely on process inputs; therefore, inputs must be sufficient.
- A complete process must, at least, have one input flow and one output flow.
How to Make a Data Flow Diagram in EdrawMax
EdrawMax is a multipurpose visual representation diagram maker that can be used in creating a wide range of graphics, charts, or diagrams. The following steps show how you can use EdraMax to make a DFD diagram.
Step 1: On your browser, open EdrawMax via this link and sign in. But if you don’t have an account yet, you can quickly sign up, click get started, and head over to step 2.
EdrawMax
All-in-One Diagram Software
- Superior file compatibility: Import and export drawings to various file formats, such as Visio
- Cross-platform supported (Windows, Mac, Linux, Web)
Step 2: On the left side of your screen, there is a blue navigation pane. On it, click “New” and then “Flowchart” to load up the templates. After that, click on “Data Flow Diagram” and wait for it to load.
Step 3: When it’s done loading, you can choose either choose one of the given templates there or create a whole new DFD. To create a new DFD, click on “+” to open a blank page where you will be designing your new diagram. But if you clicked on any TEMPLATE, a new page with a pre-designed and editable template will open. Now you can modify the template to meet your requirements.Symbols to be used are available on the lift side and others in Edraw library situated in the top navigation pane.
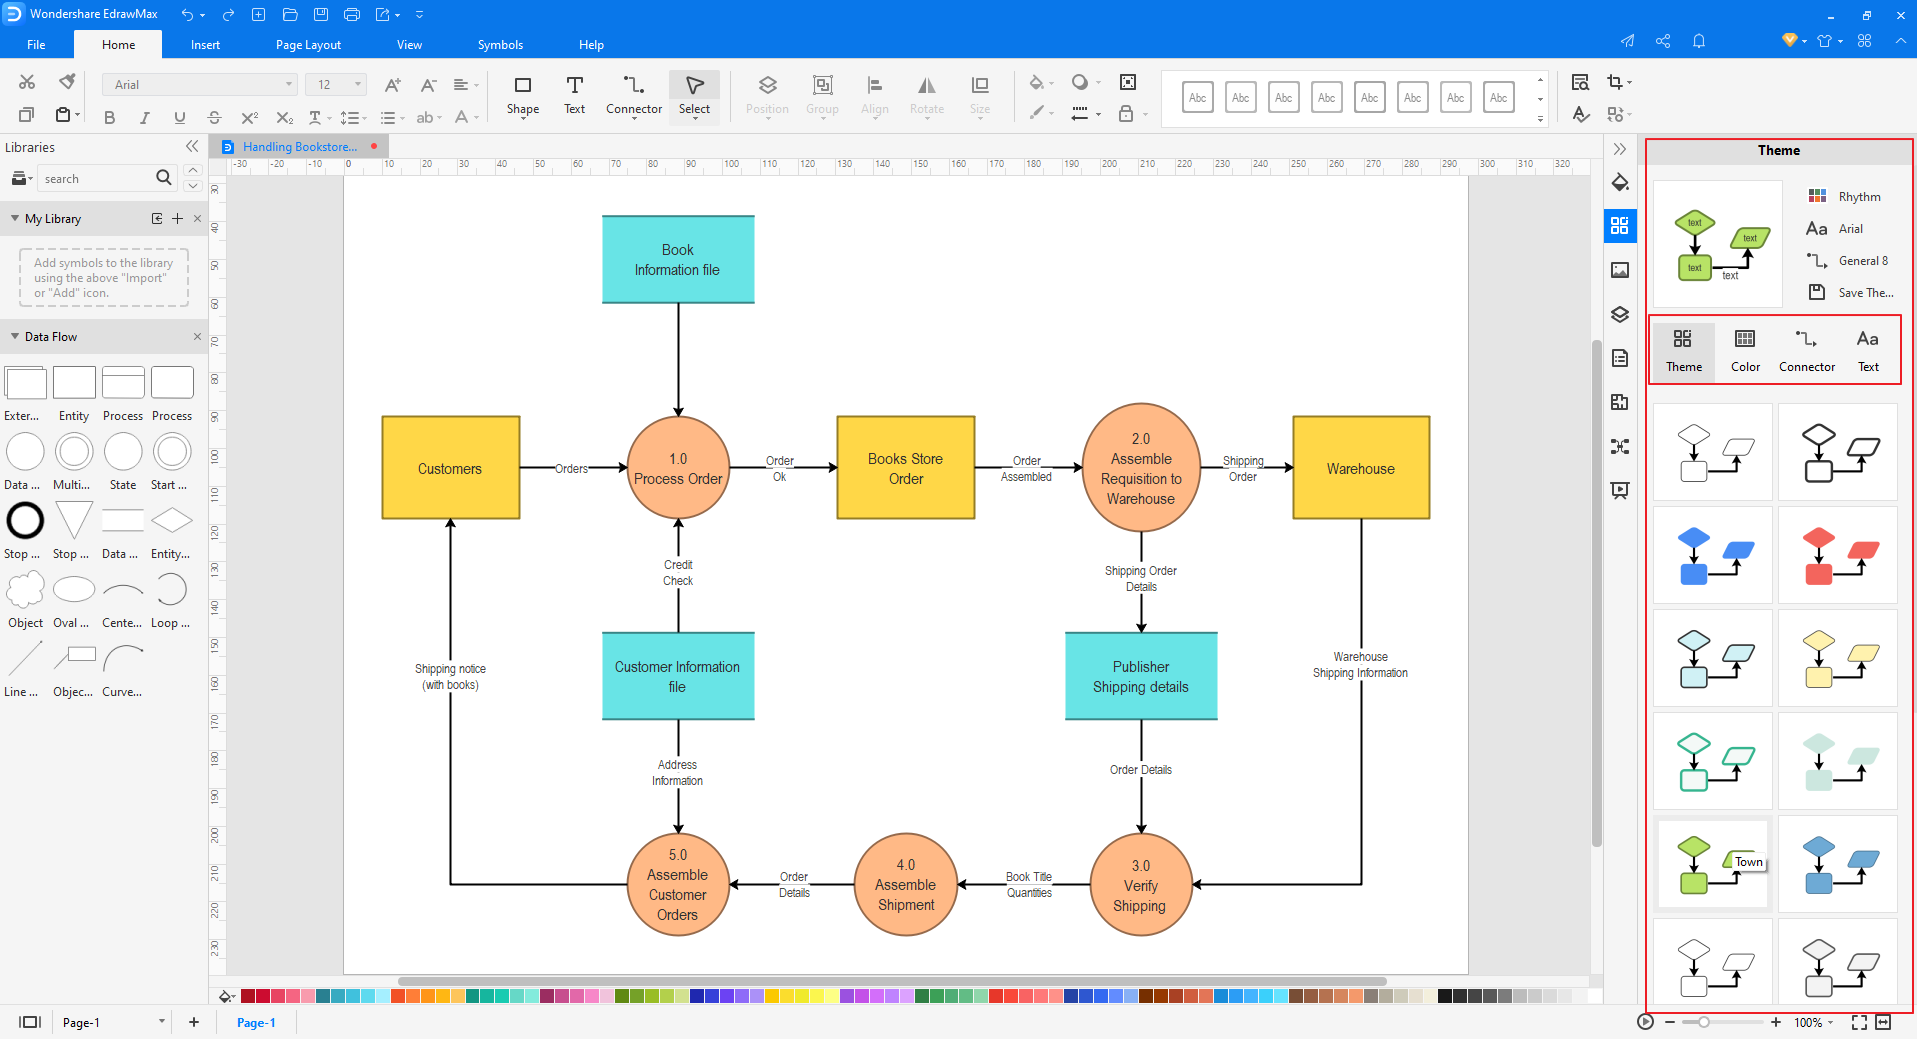
Step 4: Customize your DFD and utilize the available templates to get more creative ideas.

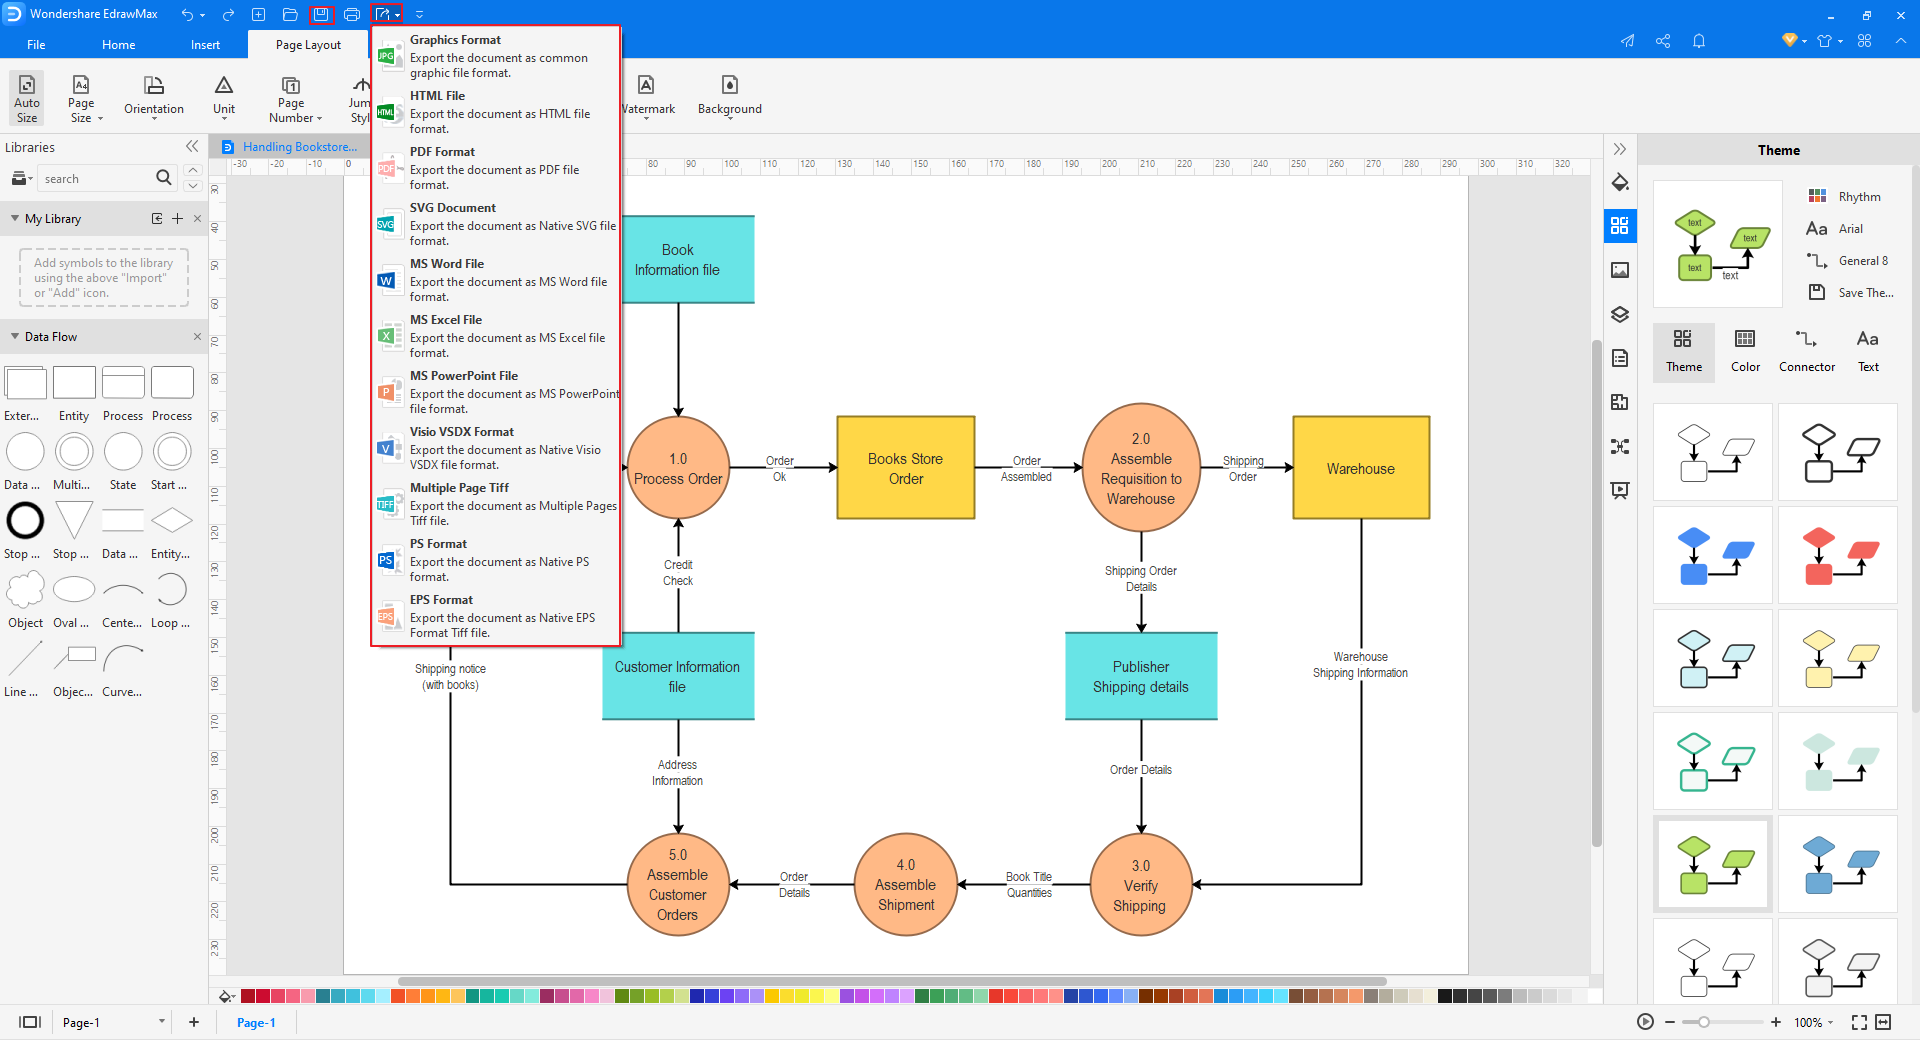
Step 5: Save your file by clicking on “File” in the top left corner of your screen, then “Save As” to choose your preferred format. The available formats include:
Data Flow Diagram Example
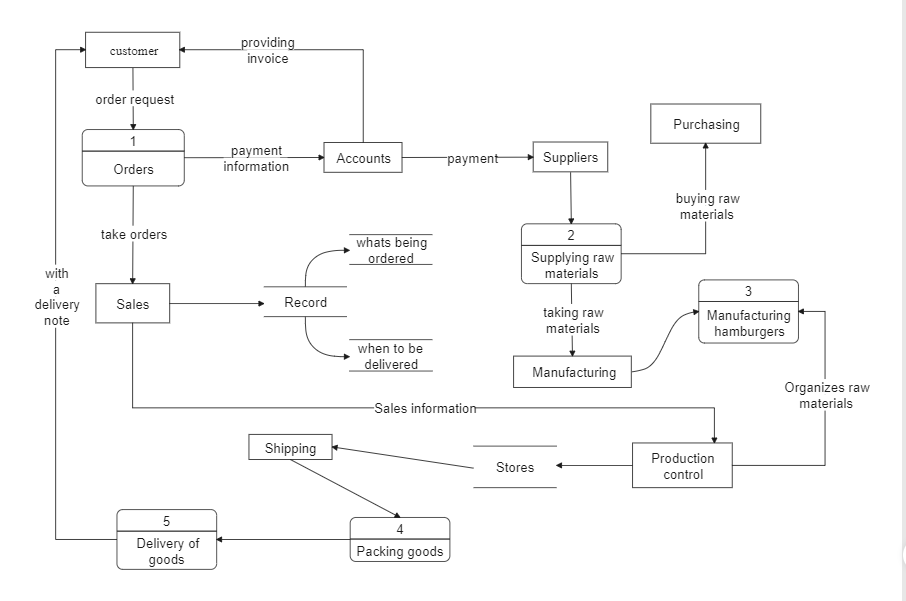
Logical Level Data Flow Diagram
This logical data flow diagram shows the process in which a food delivery company that sells hamburgers works. It shows us how data flows from the original point (customer) and all the way back to the final destination, which is the customers again.
In this diagram also we can notice two major parts, which are the transactions between:
- A customer and online food store
- The food store and suppliers
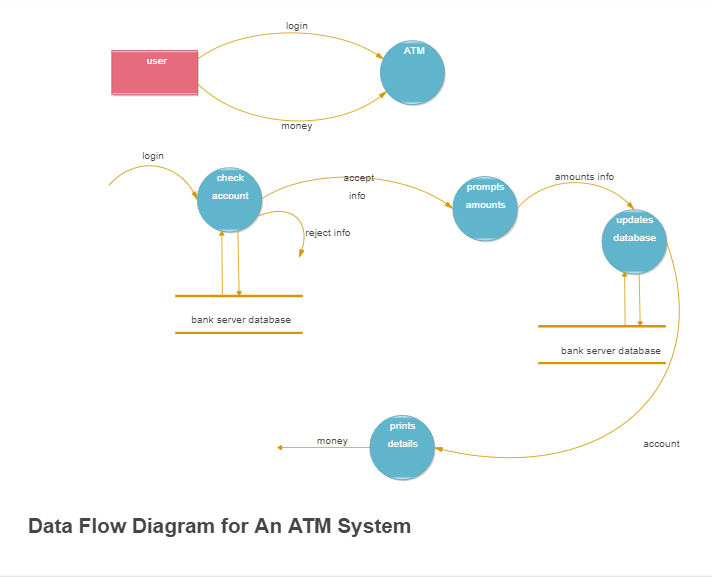
Data Flow Diagram for ATM System
This example is much simpler as compared to the first one. In this system, we can notice the following:
- Data inputs, i.e., login, accept info, etc.
- Data output, i.e., “money” from print details process and “account” from the updated database
- Furthermore, we can notice that this diagram meets all rules listed above