Simple Dashboard Software - Create Excellent Dashboards from Templates
Dashboard Software - Easy, Effective, Excellent
You've just found a superior, powerful but easy-to-use dashboard creator with extensive chart tools and templates which help to create professional-looking dashboards for sales reports, HR analysis, comparison of data, and status presentation. Due to its intuitive interface and smart features, it's incredibly easy and time-saving - with no drawing skills required.
Great Features of Edraw Dashboard Software
- Microsoft program alike interface that is you can deal with it at first sight - no need to learn.
- Dragging and dropping pre-made shapes and templates instead of drawing.
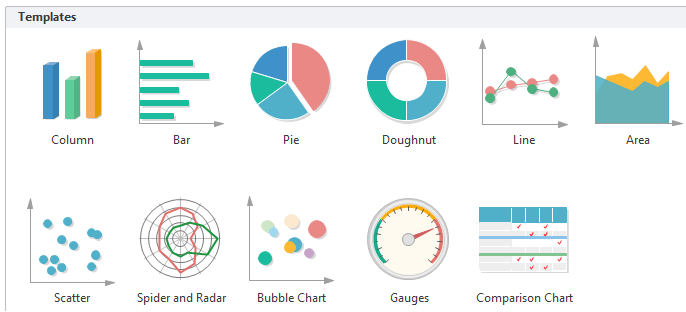
- A great diversity of charts and graphs are available, including bar chart, column chart, pie chart, doughnut chart, gauges chart, line chart, etc.
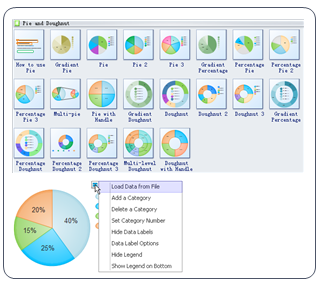
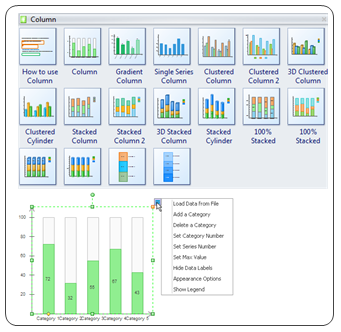
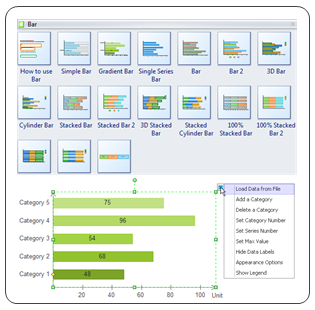
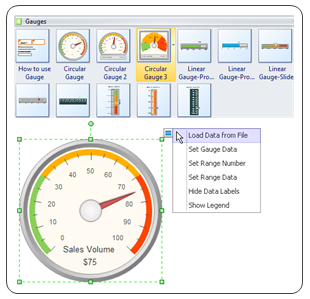
- The charts are designed with smart behaviors, which greatly simplify your work. For example, by using the floating action button on the column chart, you can one click add a category, set max value, set series number, set tick number, etc.
- It supports data import. The software can generate a chart instantly by a single click of importing a data file.
- You can change the chart's format flexibly, including adjusting sizes, colors and fill effects of individual shapes or a group of shape.
- A set of nice looking themes with advanced effects make it easy to change the whole diagram appearance with professional look.
- Enhanced export features include BMP, JPEG, EMF, WMF, PDF, SVG, HTML, Word, PowerPoint and much more format.
- New symbols, templates and functions are added continuously to equip Edraw with better and better capacity.
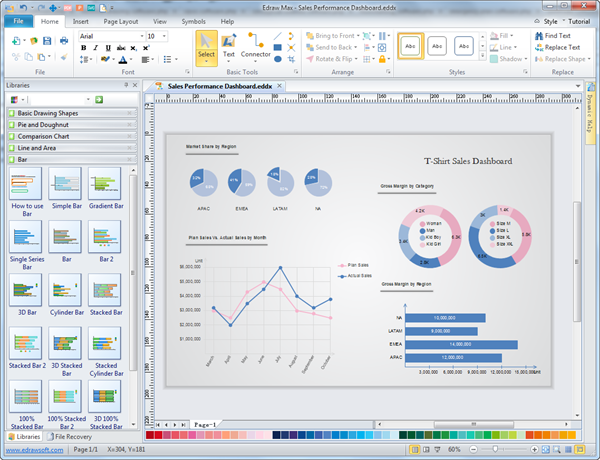
Software Interface
You will work on this easy and straightforward interface. On the top is the "Ribbon" (or toolbar) with many tabs relate to different kinds of functions. On the left is the symbol library panel containing necessary symbols and chart templates that are sorted by different categories. Multiple symbol libraries could open simultaneously. In the middle is the canvas where you create the dashboard.
Download a free trial and see first-hand how quickly and easily you can create great-looking dashboard.
Software System Requirements
Works on Windows 7, 8, 10, XP, Vista and Citrix
Works on 32 and 64 bit Windows
Works on Mac OS X 10.2 or later
Common Charts Used in Dashboard
Here shows the most frequently used charts for making dashboards. Each chart type Edraw has included various templates for quick starts. Please refer to the pictures on the right.
Click the pictures on the left you can view the video tutorial, and click the pictures on the right you can view the symbols introduction.
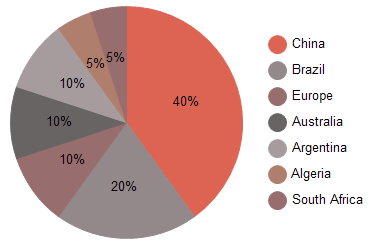
1. Pie Chart
|
|
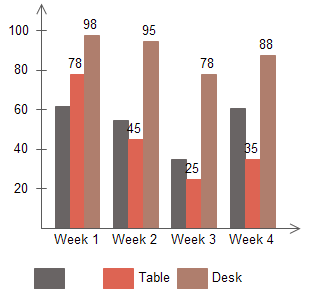
2. Column Chart
|
|
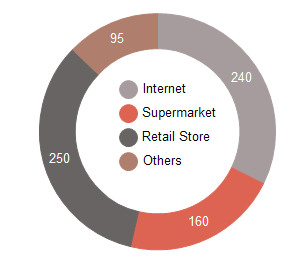
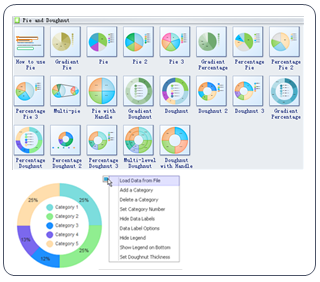
3. Doughnut Chart
|
|
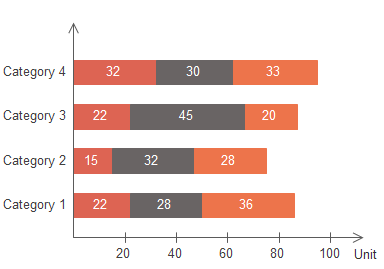
4. Bar Chart
|
|
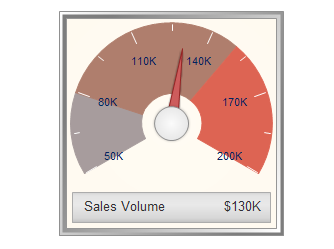
5. Gauges Chart
|
|
6. Line Chart
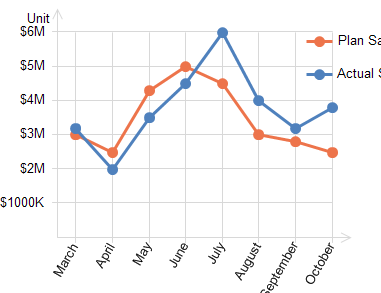
|
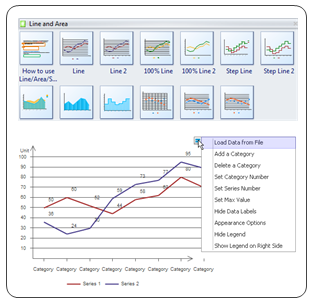
|
7. Area Chart
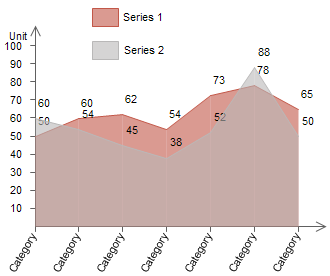
|
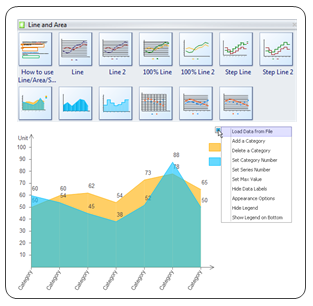
|
Dashboard Examples and Templates
Below are some dashboard samples for different purposes. You can click the small picture to enter the example page, and download the original file to edit.
Comparison Dashboard Example

This comparison dashboard example is created using dynamic charts and indicators. You can directly edit on this template and make your own comparison dashboard instantly.
HR Dashboard Example
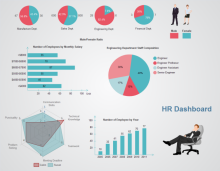
HR dashboard is an important tool to illustrate satisfaction, turnover, available positions, and more. You can make an HR dashboard like this in just minutes with Edraw.
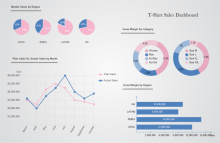
Sales Status Dashboard Template
Here is a well-created sales status dashboard template provided for users to download and use. All charts and graphs you see on this dashboard are created by existing smart templates. Try this easy method to make your own sales dashboards.
Monthly Sales Dashboard Template
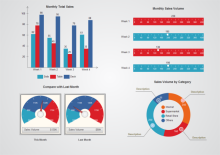
A free customizable monthly sales dashboard template is provided to download and print. In Edraw there are many tools and templates available to represent monthly sales report.
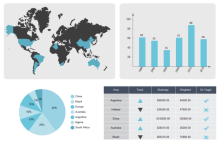
Sales Data Dashboard Template
Edraw has included a sales data dashboard template for free download. Other than the charts you see on this sales data dashboard, there are more charts and graphs templates available in use, such as pie chart, doughnut chart, column chart, scatter plot, etc.
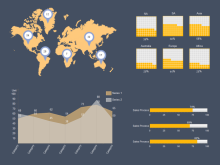
Sales Performance Dashboard Template
Sales performance dashboards are usually composed by a series of charts and graphs showing sales data. It's an essential tool for sales data presentation. Try a diversity of easily customizable templates in Edraw for creating sales performance dashboard effortlessly.