Compare and Contrast Graphic Organizers
- Part 1: What are Graphic Organizers
- Part 2: What does Compare and Contrast Graphic Organizer mean?
- Part 3: Benefits of Graphic Organizers
- Part 4: When are they Useful?
- Part 5: How to Create a Compare and Contrast Graphic Organizer?
- Part 6: Tips for Making a Compare and Contrast Graphic Organizer
- Part 7: Free Compare and Contrast Graphic Organizer Templates
- Part 8: Conclusion
Part 1: What are Graphic Organizers
Graphic organizers (also known as concept maps, entity relationship charts, and mind maps) are a visual way of arranging information and creating awareness. They assist the students in converting and compressing a large amount of apparently unrelated data into a logical, easy-to-understand graphic display. The resulting visual display straightforwardly conveys complex details.
The process of translating a large amount of data, facts, or ideas into a graphic map allows students to gain a better understanding and insight into the subject at hand. To make the map, the students must focus on the connections between the objects and the meanings associated with each one.
Graphic organizers come in a variety of types. The suitable one depends on the task at hand. Some common formats include Tree, Cloud/Cluster, Flow Chart, T Chart, Story Maps, Venn diagrams, and many more.
Part 2: What does Compare and Contrast Graphic Organizer mean?
There are numerous methods for comparing and contrasting the characteristics of objects, individuals, events, and so on. Many different types of graphic organizers make examining these similarities and differences much easier.
- Compare - to evaluate (two or more objects, thoughts, persons, or other things) in order to find similarities and differences. For instance, to compare two literary works.
- Contrast - demonstrate unlikeness or differences; note the opposite natures, purposes, etc. For instance, compare and contrast the political rights of Romans and Greeks.
The two most popular type of graphic organizers that make comparing and contrasting convenient are as follows:
Venn Diagrams
A Venn Diagram is a graphic organizer composed of two or three circles that overlap. Venn diagrams are commonly used in mathematics to visualize the relationship between two or three sets. However, Venn diagrams may also be used to compare and contrast the characteristics of other objects such as groups of people, individuals, books, characters, animals, and so on. John Venn, an English mathematician, invented these in 1880.
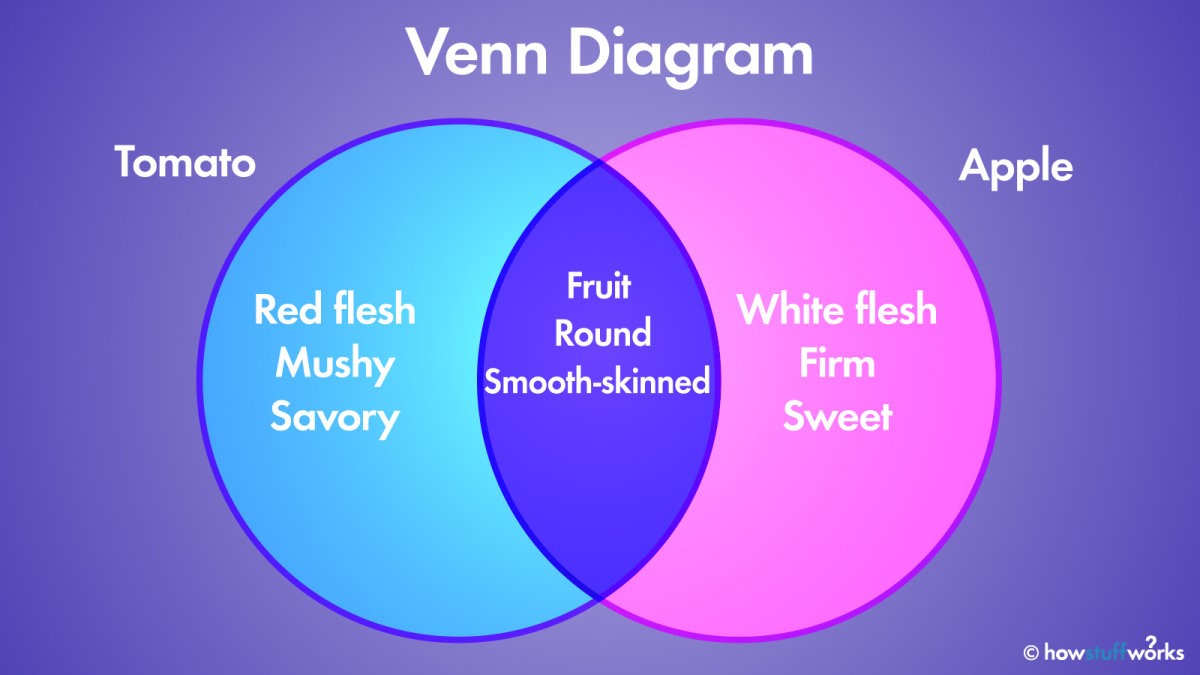
In a Venn diagram, individual characteristics are either on the left or right side of the circle, whereas, the common characteristics lie in the overlapping section in the middle.
Charts/Matrix
A chart diagram (also known as a matrix diagram or a table) is a category of graphic organizer that compresses and organizes data about multiple traits related to a large number of items or topics. Charts can be used to display item attributes, compare and contrast topics, and analyze data. For example, making a show of important inventions with information such as when, why, where, and who invented them.
In a matrix or chart, one or more items, ideas, events, places, people, etc are being compared and contrasted. Individual items are in the left and right sections respectively.
Part 3: Benefits of Graphic Organizers
Teachers and students use graphic organizers for a variety of reasons. Graphic organizers are useful teaching tools that make studying more interesting and productive by demonstrating relationships, visualizing and simplifying concepts, and organizing knowledge. A few of its benefits are stated below.
Indicate Relationship
Graphic organizers help students imagine the relationships between various parts by using colorful shapes, icons, and connectors. Venn diagrams, for example, help students see and understand the similarities and differences between objects.
Clarify Concepts
Graphic organizers may also simplify complex concepts by visualizing them, as an image is worth a thousand words. Ideas that can be seen are easier to comprehend, particularly for the learning process.
Analyze the data
It is difficult for the brain to interpret and process a vast volume of information. The details can be logically organized using the graphic organizer. For instance, charts can help remember the difference between two objects, places, persons, etc.
Part 4: When are they Useful?
Students can use the graphic organizer to illustrate the similarities and differences between two objects or ideas. Following the completion of this organizer, the information gathered could easily be turned into a classroom discussion or writing subject.
Moreover, the design of graphic organizers often aids students in generating ideas as they create and visually record their thoughts. As the student's thoughts are visually categorized, the concepts associated with a subject become clearer.
Part 5: How to Create a Graphic Organizer
Like every other diagram, making a graphic organizer is much more efficient on a software, and this is where we think EdrawMax steps up. The application by Wondershare is an easy-to-navigate tool that helps improve efficiency and enhance productivity with sketching diagrams.
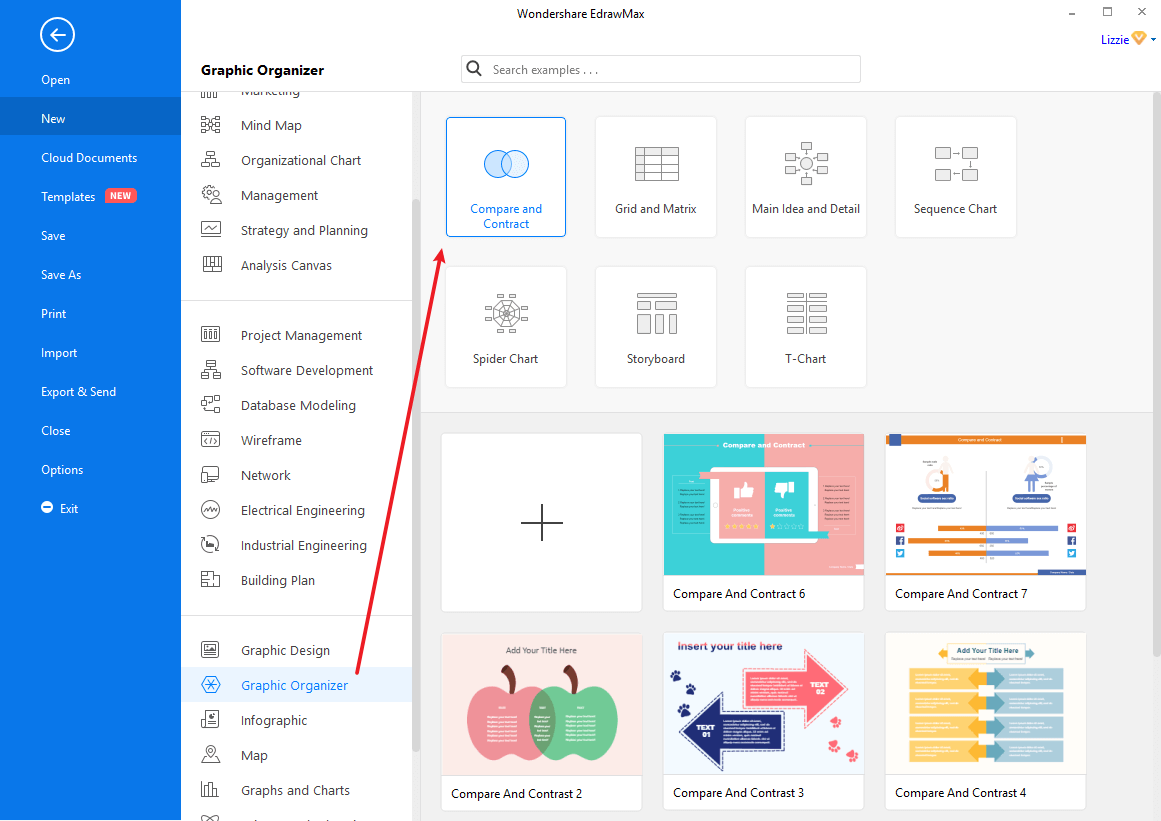
Step 1: Firstly, in the template section, select the graphic organizer from the list. Now, you will be able to see a wide range of collections. Select the template that you want to use or click the “+” icon to open a new page and start from scratch.
The important part of this step is how you choose a template. For instance, an employee can make good use of the arrows/pyramid chart for an important presentation. Whereas, a tree template would be the best for students in the classroom.
The important part of this step is how you choose a template. For instance, an employee can make good use of the arrows/pyramid chart for an important presentation. Whereas, a tree template would be the best for students in the classroom.
Step 2: You can use the symbol library to create a Tips for making from start. It is located on the left side of the panel.
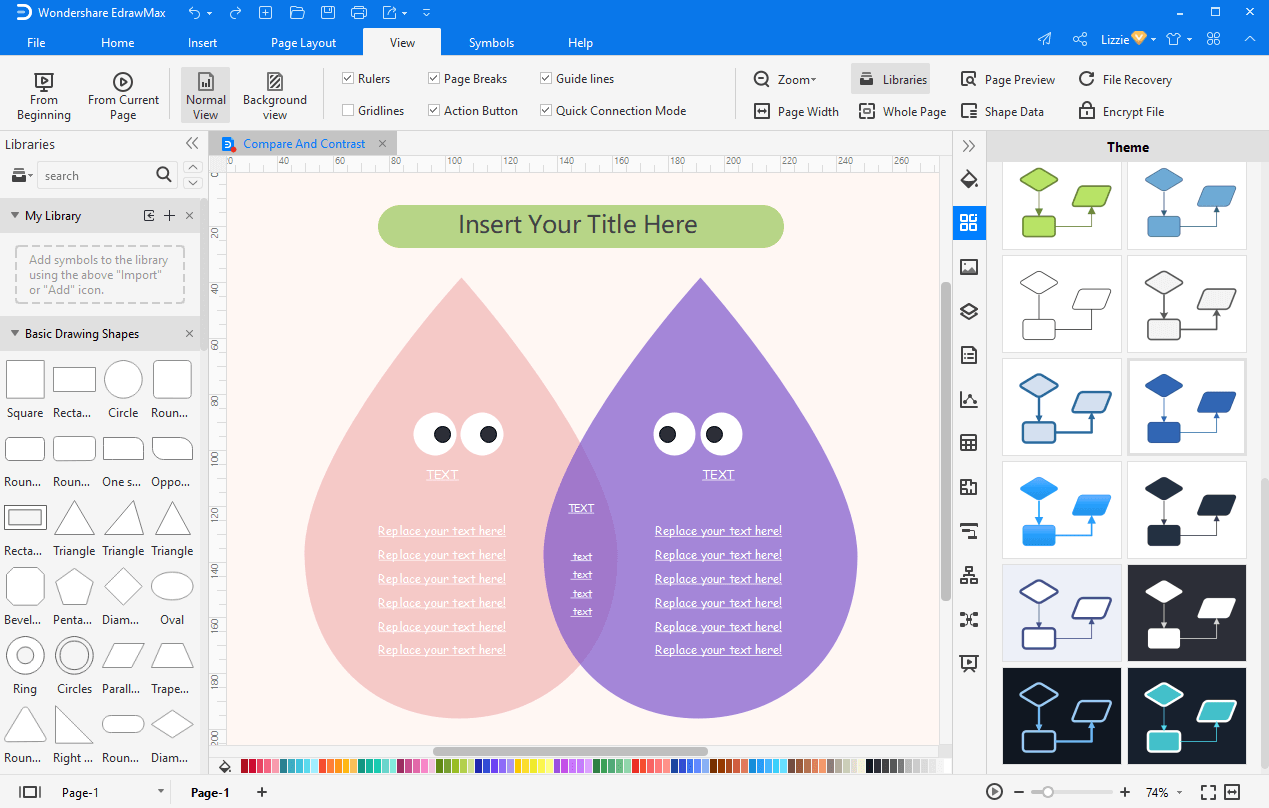
The symbols library contains a variety of symbols, including Graphs, Charts, Clip Art, Icons, Design Element, and so on. You can insert the symbol you want to the drawing page by simply dragging and dropping it. Additionally, EdrawMax also allows you to import symbols from your computer - a handy tool if you don’t find what you’re looking for.
Step 3: Now, add the title as well as text in your graphic organizer by double-clicking on the example boxes. With EdrawMax’s amazing features, you can create a professional-level graphic organizer.
Step 4: There are several tools in EdrawMax that can be used to customize the graphic organizer's data. Basic resources such as connectors, text tools, shape formatting options, pen tool, pencil tool, anchor point movement, point tool movement, geometrical shape drawing, etc are easily accessible.
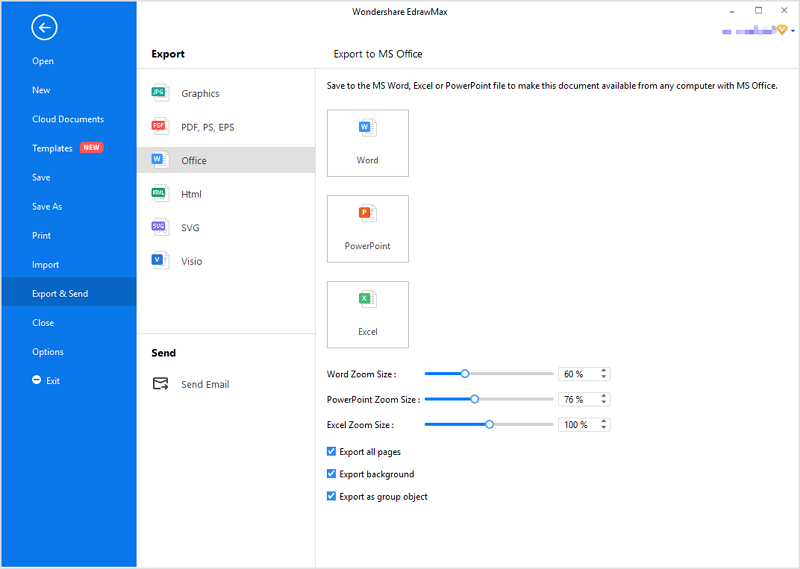
step 5 The last step includes saving the graphic organizer that you just created. The file can be saved in a variety of formats, including JPG, PDF, MS Office, HTML, and SVG. EdrawMax also has online graphic organizer saving options in Google Drive or DropBox.
With the easy steps above, you will be able to create the best diagrams and charts on EdrawMax Online. Make sure to go through their collection of interesting and amusing free graphic organizer templates.
Part 6: Tips for Making a Compare and Contrast Graphic Organizer
To make your diagrams and charts stand out, you can do the following:
- Insert pictures for a better visual display.
- Add color-coding to improve the usability and readability even further.
- Use tools such as connectors, shape formatting, pen, etc.
- Do thorough research on the topic so you know what to include and what to not.
Part 7: Free Compare and Contrast Graphic Organizer Templates
Listed below are a variety of graphic organizers that everyone can use to compare and contrast some things. You can choose any suitable template or save all the files to edit in EdrawMax.
Template 1 - Venn Chart
Whether you use it to make curriculum plans or print it out as worksheets, this Venn diagram will definitely be of great help. Click the picture to download and learn more about using Venn diagrams for teaching. Venn Chart Examples >>
Above is an example of a Venn diagram template available at EdrawMax. A Venn diagram is a diagram that uses circles to depict relationships between objects or finite groups of objects. You can make use of this template to compare and contrast the similarities and differences of two or more objects, ideas, concepts, products, places, etc.
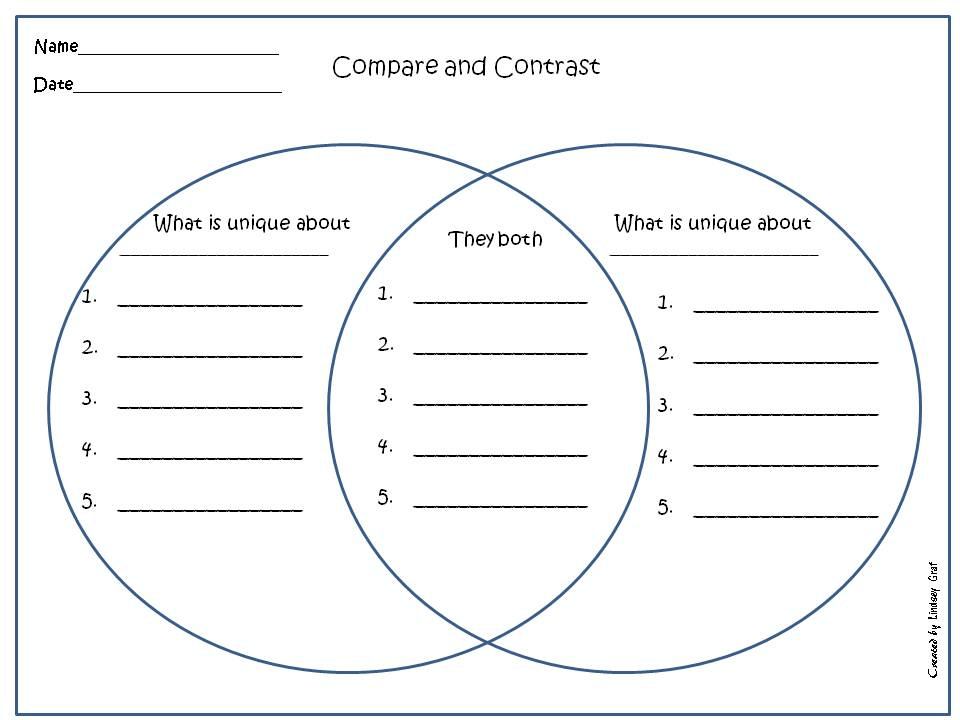
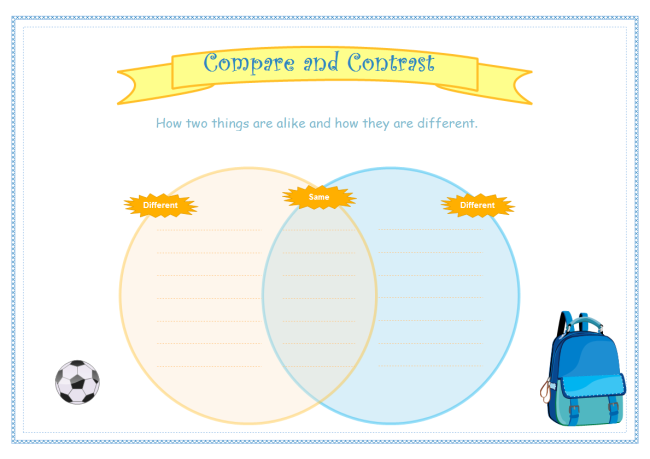
Template 2 - Compare and Contrast Worksheet
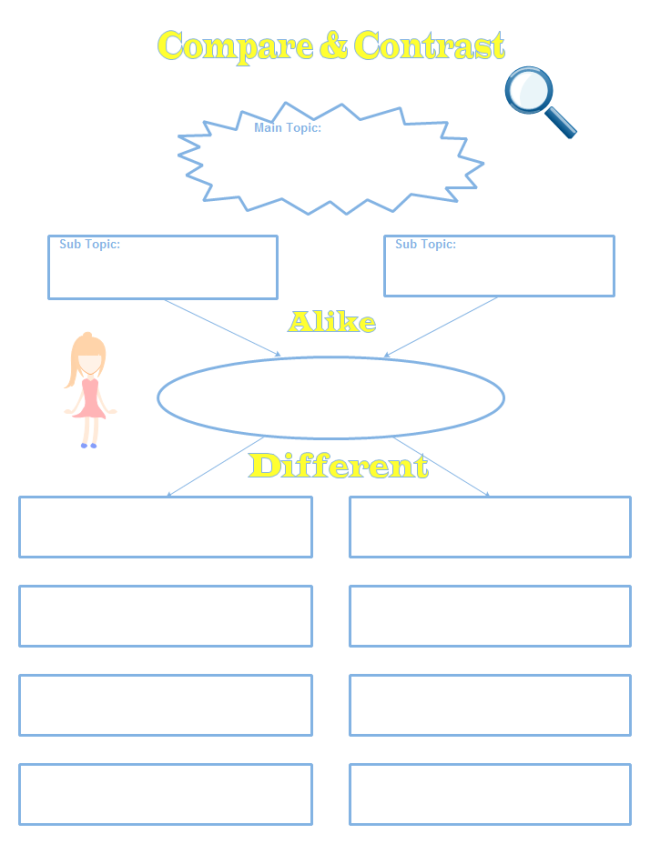
This compare and contrast worksheet is simple but very useful. You can print it out and let students fill in the blank areas when you teach them to differentiate two concepts or items. If you want to change the number of text boxes in the "different" part, you can download the EDDX file of the template and edit it in EdrawMax.
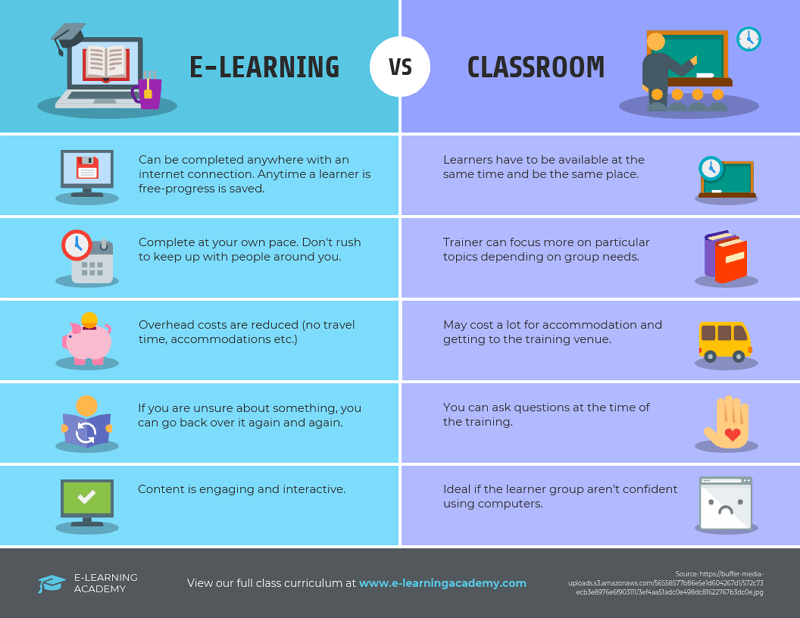
Template 3 - Compare and Contrast with Topics
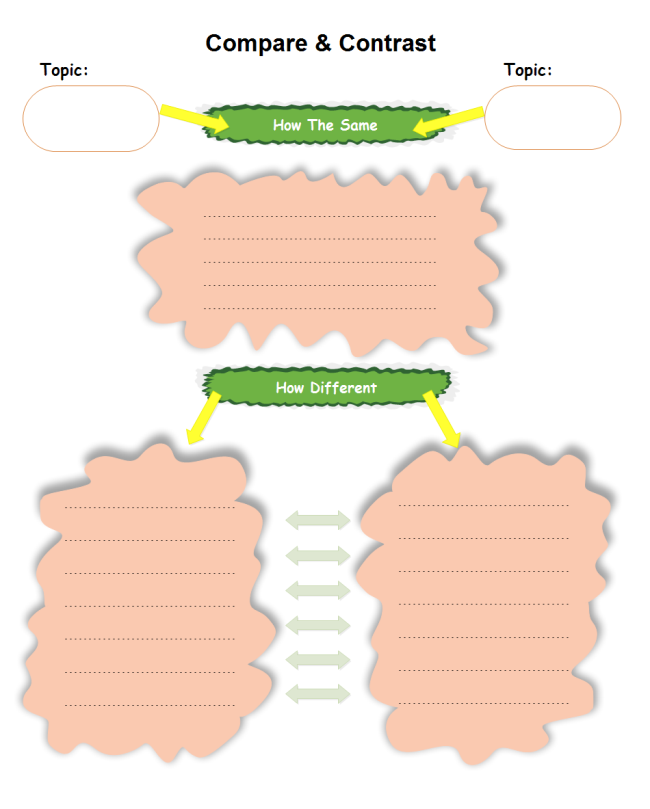
This cute comparison and contrast diagram template is great to be used in PPT presentations and worksheets. It will make students' homework interesting and enjoyable. Come and click the picture to download the PDF or EDDX file.
Template 4 - Compare and Contrast Chart for Students
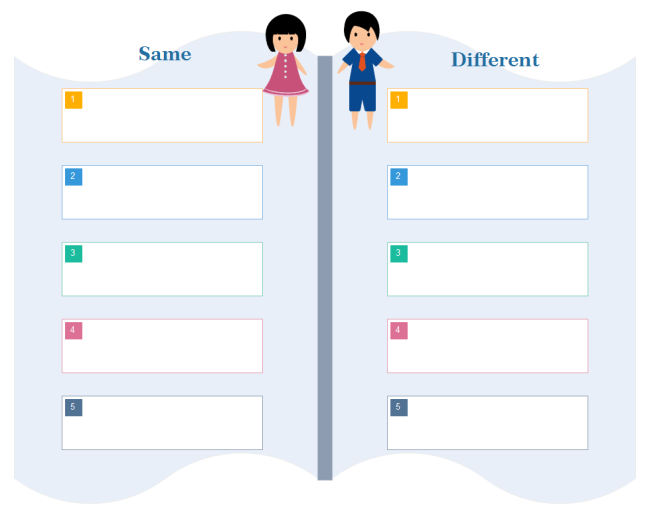
This simple compare and contrast chart template is also very useful in teaching. Quickly download it from our website and use it in your class.
Part 8: Conclusion
A compare and contrast graphic organizer is the best way to gain quick insight into a topic. It is a pictorial way of arranging and organizing information that is easy to understand as well as learn. Besides, they are essential during classroom lessons and office meetings. As a result, both students/teachers and employees can benefit from it.
In the above article, the compare and contrast graphic organizer’s benefits, usefulness, and the process of how to make them were described. Visit EdrawMax today for more details!