Causal Loop Diagram Software
What is Causal Loop Diagram?
A causal loop diagram (CLD) is a method used to understand and analyze complex systems. It helps identify key variables in a system, and shows the cause and effect relationships between the variables. There are four basic elements in a causal loop diagram: the variables, the links between them, the sign on the links, and the sign of the loop (type of behavior the system will produce).
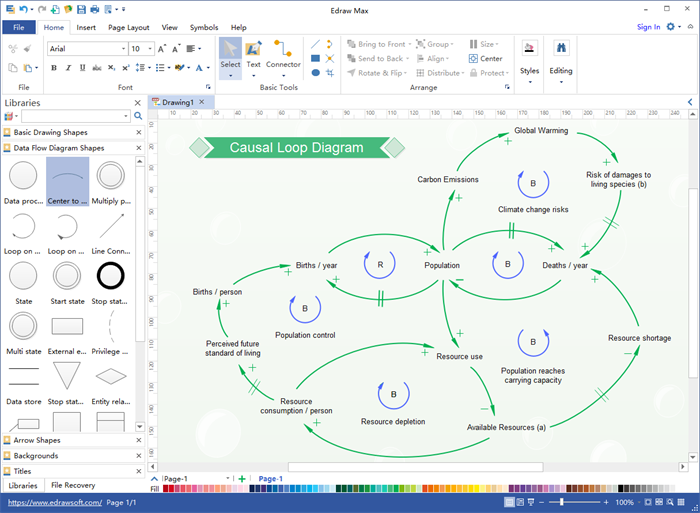
A Causal Loop Diagram Software
Drawing clear and beautiful causal loop diagram requires a professional drawing tool. EdrawMax offers everything you need for making causal loop diagrams. With powerful drawing toolkit and abundant shapes, it allows users to make causal loop diagram as easy as pie. You can draw loops at any direction, add content boxes, use quick shapes, apply different colors, and so on. More importantly, its powerful sharing feature makes it easy to export your causal loop diagram to PPT, Word or PDF, and share with others immediately. Learn "How to Create Causal Loop Diagram".
EdrawMax
All-in-One Diagram Software
- Superior file compatibility: Import and export drawings to various file formats, such as Visio
- Cross-platform supported (Windows, Mac, Linux, Web)
These Features Let You Create Any Loop Diagram:
- It's a cross-platform based program available on both Mac and Windows. Mac users can also create causal loop diagram on their Mac devices.
-
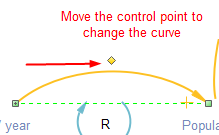
It's highly flexible. Based on vector drawing technics, everything you draw are easily customizable.
- It allows you to start from templates. Don't know how to start? Never mind. It has predefined templates to help you start as fast as lightning.
- It offers lots of export options. With a simple click, you can covert your drawing to Word, PPT and PDF, with no quality loss.
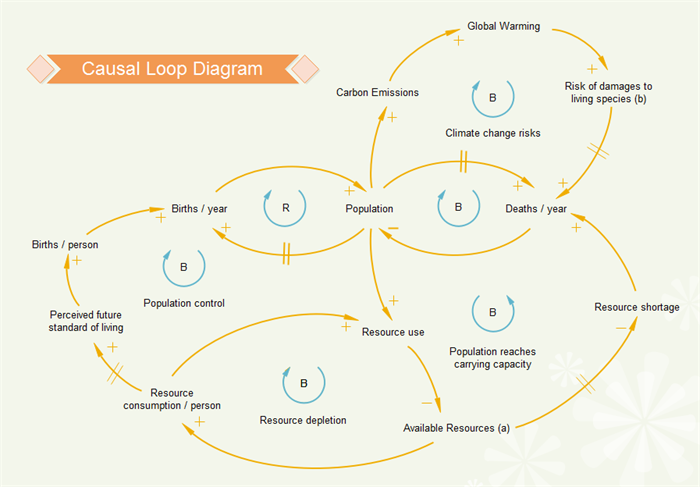
Causal Loop Diagram Example - Population Growth
Here is an easy causal loop diagram example. If needed, you can click the image and download the original template for your own use.
Kanban VS Scrum: Difference and Complementation