Bar Chart Software
Introduction to Bar Chart
A bar chart or bar graph is a chart with bars with lengths proportional to the values that they represent. Usually, the bars are rectangle. Some designers choose to use cylinder bars to build customized bar charts.
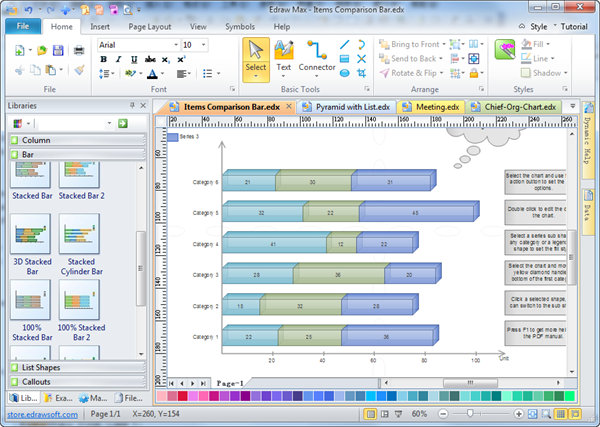
Smart Bar Chart Software - Build Bar Chart Automatically
Our awesome diagramming community strives to design a premier bar chart creating platform built with professional features, free technology support as well as ease-of-use.
Discover why Edraw is an awesome chart maker: Try it FREE.
System Requirements
Works on Windows 7, 8, 10, XP, Vista and Citrix
Works on 32 and 64 bit Windows
Works on Mac OS X 10.2 or later
Why Choose Edraw Bar Charting Software
1. Saving Time and Money
Various templates and examples help you quickly build bar charts in minutes. 1-click create and connect function save you tons of time wasted on cobbling shapes together and manually connecting objects. It provides many options to do things and has the most to offer for a reasonable and affordable price. We assure you this will be great worth for your money with free maintenance and upgrade service forever.
2. Smart Tools and Shapes
Every time you open the Bar Chart Example, the first thing that comes into eyes is the guide of "how to use bar". Additionally, every time you move the cursor over an icon of example or shape, it will automatically shows you how to apply it, which is extraordinarily thoughtful and time-saving. That means you don't have to spend tons of time to find out how to use the application. You may feel like you are following a considerate guide in a relaxing tour. Plus, the link of User Manual is also added in the guide. You can search for more detailed help directly within the drawing page. That is fabulous.
3. Powerful Interaction Function
With the interactive functionality of hyperlink, you can surely deeply amaze and impress your leader or other audience. Can you believe that you can even open another application within this program with only 1 click? It is true with Edraw. By linking web pages, attachment, note or other files, you can navigate back and forth with great ease and show all you have got even within only one page. Such powerful one-stop solution is definitely a must for you. You won't regret to have it.
4. Flexibility and Compatibility
Its flexibility lies in the generic graphic format support, which allows users to import Visio XML files perfectly. It can be integrated with Microsoft Office easily and seamlessly. The MS Office-like UI is easy to learn and use. Users familiar with MS Office will become familiar with Edraw soon.
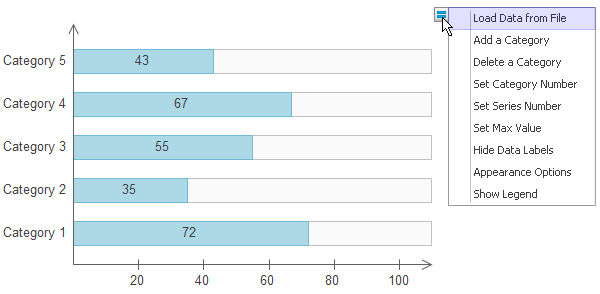
How to Set Chart Data
The first way to set chart data is loading data from file. You can copy the example text included in the User Guide to newly created text (.txt) file, save the source data, select a bar chart shape, click floating menu Load Data from File to load the text file.
The second way to set Line/Area/Scatter chart data is edit the data labels and click floating menu to change its setting.
Rest the pointer over the shape to show the floating button. Point over the button and click a menu needed to make necessary change.
Main Features Summary
Diverse data sources (csv, text, xls, xlsx)
Printer-friendly, what you see is what you get
Multiple Graphs
Labels on/off, Font and Color selectable
Show/hide Axis
3D/Gradient/cylinder/stacked bar
Selectable Marker Symbols
Automatic Legend generation
Label orientation
Various data formats: Normal, Thousand Separator, Brevity
Configurable Number of decimal places to show values
Free form Images can be incorporated into the Chart Canvas
Free form Lines of Text can be incorporated into the Chart Canvas
Bar charts are designed for visual representation of data so that comparisons and trends will be clearer. With lots of pre-drawn bar graph examples and more than 6000 symbols, charting has never been so easy!
It works at the following bar graphs:
Edraw is easy to design simple bar graph, horizontal bar graph, range bar graph, cylinder bar, histogram, 3d bar, stacked bar, 100% stacked bar, grouped bar graph, composite bar graph and more. The picture below is the bar chart symbols in our software which will be of great help when you draw bar charts.
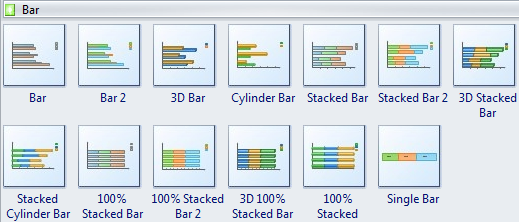
Bar chart illustrates comparisons among individual items.
3D bar chart is available with a 3-D visual effect.
Clustered bar compares values across categories.
Cylinder bar is also available with a 3-D visual effect to place focus on comparing the values.
Stacked bar shows the relationship between individual items and the whole.
3D stacked bar is also available with a 3-D visual effect.
100 % stacked bar compares the percentage each value contributes to a total according to categories.
3D 100% stacked bar is also available with a 3-D visual effect.
Single bar compares the percentage of items.
Bar Chart Example - Sales Report
Here shows an elaborately-made bar chart example, which is editable, printable and sharable.
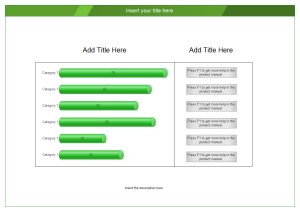
Bar Chart Example - Sales Comparison
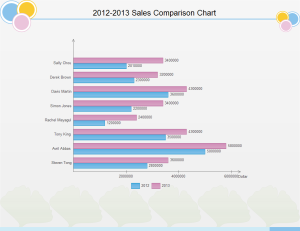
An editable example of sales comparison bar chart is provided on the right. Use it to present your own bar charts.